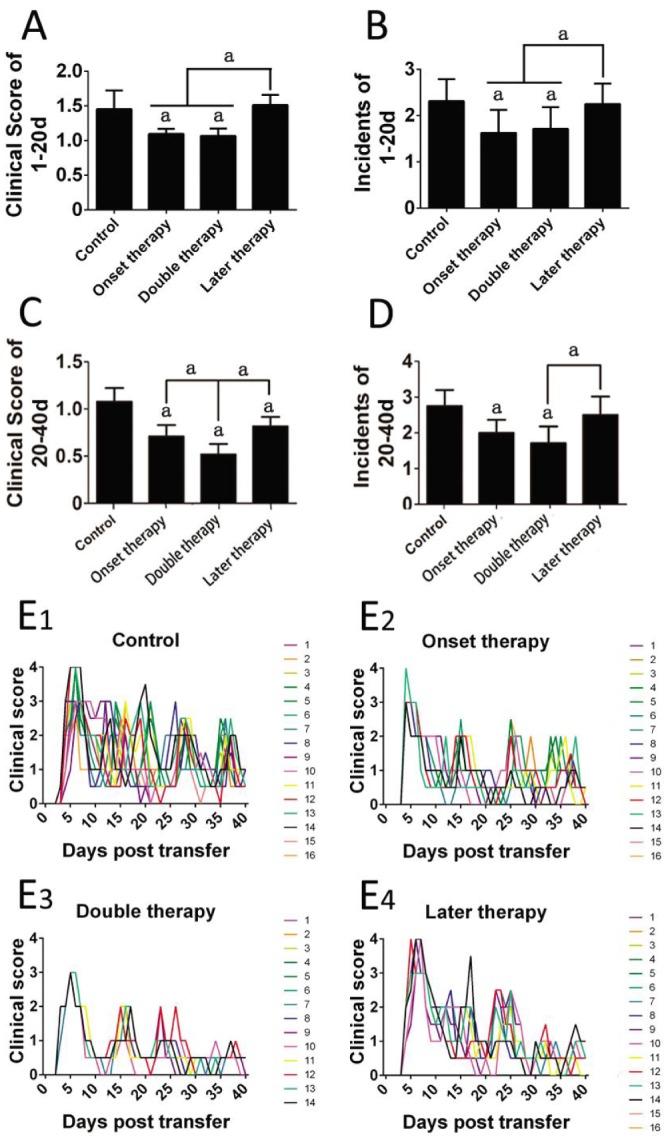
Figure 1. Clinical evaluation of different MSC therapeutic protocols.

The mean clinical scores and incidence for the first 20d (A, B) and the last 20d (C, D) were compared among different groups. The clinical score curves of all the eyes in different groups were presented as overlays. Eight rats (16 eyes) were used in each group of control, onset therapy and later therapy, and 7 rats (14 eyes) in double therapy; aP<0.05.
