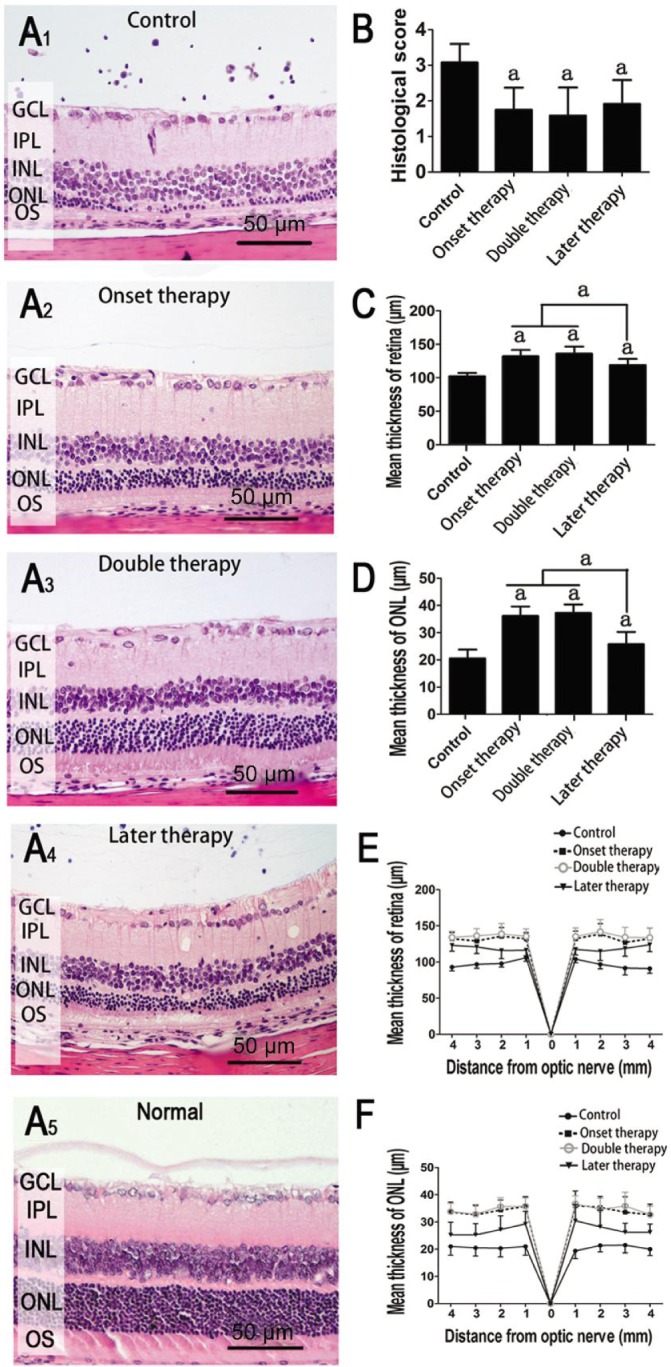
Figure 2. Histological changes of the retina on day 40.

A: Representative retinal histological features; B: Histological evaluation of different groups; C, D: Average thicknesses of retina and ONL; E, F: Thicknesses of retina and ONL were measured at 8 retinal locations at 1 mm intervals. Values are expressed as mean±SD. Eight rats (16 eyes) were used in each group of control, onset therapy and later therapy, and 7 rats (14 eyes) in double therapy; aP<0.05 compared to uveitis without treatment group.
