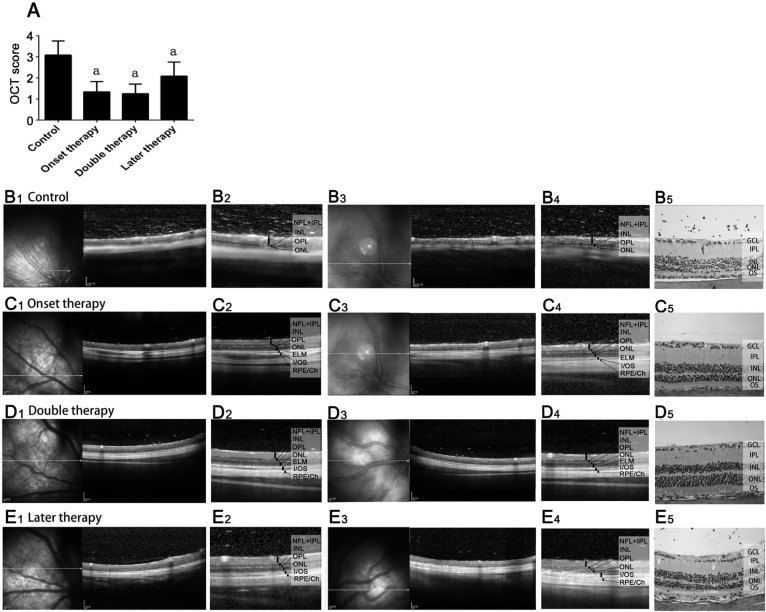
Figure 4. OCT evaluations.
A: OCT image evaluation of different groups; B-E: Typical OCT changes of two eyes from different groups (B1-E1 and B3-E3 covered a range of 4 mm of the retina, whereas B2-E2 and B4-E4 covered a range of 2 mm). Matched histology demonstrated similar changes as in OCT scan (B5-E5). Twelve eyes of 7-8 rats in each group; aP<0.05.

