Abstract
New gas therapies using inert gases such as xenon and argon are being studied, which require in vitro and in vivo preclinical experiments. Examples of the kinetics of gas transport during such experiments are analyzed in this paper. Using analytical and numerical models, we analyze an in vitro experiment for gas transport to a 96 cell well plate and an in vivo delivery to a small animal chamber, where the key processes considered are the wash-in of test gas into an apparatus dead volume, the diffusion of test gas through the liquid media in a well of a cell test plate, and the pharmacokinetics in a rat. In the case of small animals in a chamber, the key variable controlling the kinetics is the chamber wash-in time constant that is a function of the chamber volume and the gas flow rate. For cells covered by a liquid media the diffusion of gas through the liquid media is the dominant mechanism, such that liquid depth and the gas diffusion constant are the key parameters. The key message from these analyses is that the transport of gas during preclinical experiments can be important in determining the true dose as experienced at the site of action in an animal or to a cell.
Keywords: pharmacokinetics, xenon, argon, rats, noble gases, neuroprotection, organoprotection
INTRODUCTION
In recent years, accumulating evidence has indicated that certain inert or noble gases with low chemical reactivity nevertheless express biological activity. Numerous in vitro and in vivo studies have demonstrated intriguing biological effects for xenon (Xe) and argon (Ar), in particular, with neuro- and organo-protective properties as the most clinically promising (Coburn et al., 2012; Deng et al., 2014; Hollig et al., 2014; Winkler et al., 2016).
Determining dose-response characteristics for gaseous compounds is challenging because of the time lags and partitioning between gas partial pressures (or concentrations) in the ambient exposure environment and those in fluids, cells, or tissues. Accordingly one aspect of the design of preclinical experiments that is of fundamental importance in determining the administered dose is the kinetics of gas transport to the cells or animals (e.g., Tancredi et al., 2014). Determining the dose is complicated by the fact that all open spaces filled with gas (apparatus dead volume) experience a wash-in phase and by the further time lag to gas delivery due to diffusive transport through liquid or solid barriers (potentially organic or inorganic). In addition, gas solubility in biological fluids and tissues varies considerably between gas species. These issues will become especially relevant as experiments are performed to determine minimally effective doses (e.g., Langston and Toombs, 2015).
In this paper, using analytical and numerical models, we analyze an in vitro experiment for gas transport to a 96 cell well plate and an in vivo delivery to a small animal chamber. These two representative examples can be used as a basis for guidance to research labs in developing their own experimental designs. Xe and Ar are used in these examples but the concepts are readily applicable to other inert or non-inert gases with the caveat that the mass balance of reacting gases would necessarily need another level of analysis.
METHODS
The Methods are organized into an in silico treatment of an in vivo small animal exposure section and an in vitro cell exposure section; key subsections considered are the wash-in of test gas into an apparatus dead volume, the pharmacokinetics (PK) of a rat, and the diffusion of test gas through the liquid media in a well of a cell test plate.
In vivo analysis
Chamber wash-in
As fresh gas enters a chamber, it is assumed to fully mix with the air already present such that the displaced gas leaving the chamber includes the test gas (the flow is incompressible so the gas supply volume flow rate is exactly matched by gas flow rate that exits the chamber). This wash-in process is well described by the following exponential solution for the box concentration to a first order differential equation given by Leavens et al. (1996).

Where Cchamber is the concentration of the test gas in the chamber, Cgas is the concentration of the test gas in the supply mixture, τ is the time constant, Vchamber is the chamber volume and Qsupply is the flow rate of gas mixture into the chamber.
The example to be considered herein consists of a chamber (Vchamber=37 liters) with one rat supplied by Qsupply= 5 L/min of test gas (Cgas = 50% Xe or Ar, the remainder being oxygen). In general, the low limits for chamber size and flow rate are based on consideration of animal comfort and lack of excitation while the flow rate must provide adequate exchange of oxygen, carbon dioxide, heat and humidity (Leavens et al., 1996).
The physiological characteristics of the rat we considered are body weight of 250 g, minute ventilation (the volume inhaled over one minute) of 0.18 L/min, alveolar ventilation of 0.117 L/min, and cardiac output of 0.083 L/min (Katz et al., 2015). It is assumed the animal is placed in the chamber before the test gas is supplied. An exposure durations of 60 minutes is considered.
Animal wash-in: pharmacokinetics
During the chamber wash-in the subject animal will receive the gas at an increasing concentration until the chamber wash-in is completed. Thus the chamber wash-in combined with the animal wash-in will determine the dosage. To assess this process the chamber wash-in results using equations 1 and 2 are used as input for a physiologically based PK model for rats presented in a previous paper (Katz et al., 2015). In brief, The absorption, distribution, metabolism and excretion (ADME) models are as follows: absorption in all compartments (here a compartment is a particular anatomical unit for which the mass balance takes place, i.e., the brain) is assumed to be perfusion limited, no metabolism of the gases occurs, and excretion is only considered as the reverse process of absorption through the lungs followed by exhalation. The model is based on the one described by Lockwood (2010) using the Simbiology Toolkit of MATLAB (Mathworks, USA).
The dose of a gas treatment is typically given as the concentration (molar, by volume, or by parts) of the inhaled supply gas, not the gas uptake or concentration in a particular compartment. Herein, as opposed to the supply gas concentration, the variable AUC (area under the curve), the integral of concentration in a target compartment through time that reflects the total exposure of a compartment, will be used to interpret the dose for in vivo animal experiments (Blanchard et al., 1997).
In vitro analysis
The application analyzed is for a 96 well cell plate placed into a gas tight chamber (e.g., model CR1601, EnzyScreen, Nethelands) (see Figure 1), as used in recent experiments investigating in vitro effects of Ar and Xe (Spaggiari et al., 2013; Ash et al., 2014). The gas delivery was considered in four distinct parts, which occur simultaneously: 1) wash-in into the chamber, 2) head space filling of cell plate wells, 3) diffusion through liquid media, and 4) final diffusion into cells. As discussed below, the dominant part in terms of transport time is the diffusion through liquid media which will be analyzed in the greatest detail.
Figure 1.
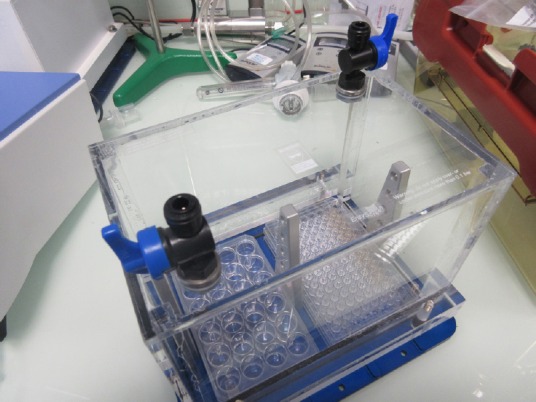
An EnzyScreen chamber for gas exposure to in vitro cell experiments.
Note: The gas supply connections on the top surface. Inside the chamber are a 96-well and a 30-well cell plate.
Chamber wash-in
The time constant can be calculated based on the volume (4.4 L empty) and the flow rate of fresh gas into the box. For example, if Qsupply = 5 L/min, the time constant τ = (4.4 L)/(5 L/min)=0.88 minutes. The wash-in process would be completed by 4 or 5 (representing 98% to 99% wash-in, respectively) time constants, or about 4 minutes. Of course, if the flow rate is different from 5 L/min, the wash-in time will be different.
Well cell plate head space filling
The well cell plate includes a cover plate with access holes along the sides to allow fresh gas to pass in the head space above the wells that are filled with a liquid media (Figure 2). The time to wash-in by diffusion (and perhaps convection) and fill this gas head space is assumed to be very short compared to the time to diffuse through the liquid. This assumption can be evaluated by calculating the order-of-magnitude of the diffusion time (t) for each instance using t~L2/D. The diffusion constant for Xe in oxygen is D = 1.2 × 10⁻¹ ~ 10–1 cm2/s (Katz et al., 2011) while in water it is D = 1.55 × 10⁻⁵ ~ 10–5 cm2/s (Wilhelm et al., 1977). The distance for diffusion, L, is on the order of 10 cm in the head space and 1 cm in the wells. Thus the diffusion time for the Xe in the head space is ~103 seconds and is ~105 seconds (to be calculated in greater detail) to diffuse through the water in the wells. This difference of ~102 indicates that the time to fill the head space will be very short compared to the time to diffuse through the liquid and so will be neglected relative to the diffusion through the liquid media in the wells as described below.
Figure 2.
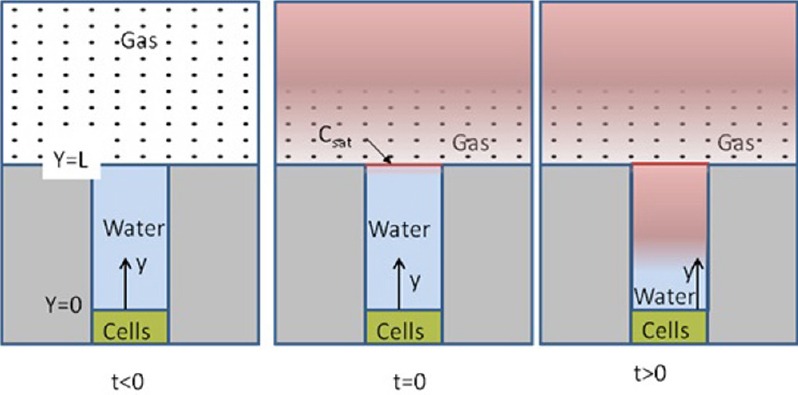
Schematic gas transport into the headspace and of the diffusion process through the water filled cell plate well.
The mathematical formulation of the problem are given in equations 3–5.
Diffusion through liquid media
The process of gas transport within a cell well is depicted in Figure 2. At time t < 0 the head space is filled with air. Following the discussion of well cell plate head space filling above, we assume that the head space is “instantly” filled with the test gas at t = 0. This creates an elevated (saturated) concentration boundary condition at the liquid (assumed to be water for this calculation) based on the gas concentration modified by the solubility coefficient (equivalent to a partition coefficient). For t > 0, the gas molecules diffuse through the liquid toward the cells.
The mathematical description and solution to the one-dimensional diffusion problem that describes this problem is well known (e.g., Mills, 1992).

Where C is the concentration in the liquid and D is the diffusion coefficient in water.

Initial Condition: C(y,0)=0 except at the water surface y = L, where C = Csat.
The solution to this differential equation in the form of a Fourier series is given below.

Where Fo is the Fourier number for non-dimensional time: Fo = Dt/L2. Property data for the noble gases are given in Table 1. In Table 1, the gas concentration, Cgas, in mol/L is related to the percentage by volume, %gas (equivalent to the molar percentage), by the perfect gas law.
Table 1.
Property values and boundary condition used for diffusion through water calculations (Wilhelm et al., 1977)
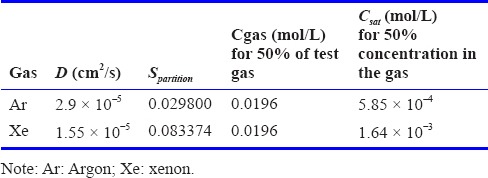

where R = 8,314.4621 Pa.L.mol–1. K–1 is the universal perfect gas constant, the temperature is T = 310K and the total pressure is assumed to be Ptotal=1 atm=1.01325 × 10⁵ Pa. Spartition given in Table 1, is the partition coefficient that indicates the ratio between the concentration in the liquid (again assumed to be water here) and in the gas phase. These values are used to determine the boundary condition Csat.
Final diffusion into cells
A first approximation for the time for a final diffusion process to the cells is that it is negligible compared to the diffusion through the liquid water in that depth of cell culture (usually a monolayer ~100 μm (Harris et al., 2012)) is much less than the liquid media above it. Furthermore, the property data necessary to perform a calculation on this media is not known, but if the cells are also considered to be water, this layer is only ~10–4 of the layer thickness of the liquid above it.
Herein, as opposed to the supply gas concentration, the concentration at the cells over time will be used to interpret the dose for in vitro experiments (Blanchard et al., 1997).
RESULTS
In vivo analysis
The results of the analysis of the in vivo experiment supplying 50% of Xe or Ar to a test chamber holding a rat are summarized in Figure 3. First note the dashed curve representing the wash-in to the chamber that for this example is completed after about 40 minutes consistent with the time constant equal to τ = 37 L/5 L/min = 7.4 minutes. That is, the wash-in is complete after about five time constants as discussed previously. The curves representing brain concentration for Xe and Ar follow the chamber wash-in indicating the PK within the animals has a much faster response. In fact, it was shown in the previous paper (Katz et al., 2015) that the time to maximum brain concentration for Xe in a rat is only 1 minute. For comparison, in the rat the arterial blood would be saturated in about half the time as it takes to saturate the brain.
Figure 3.
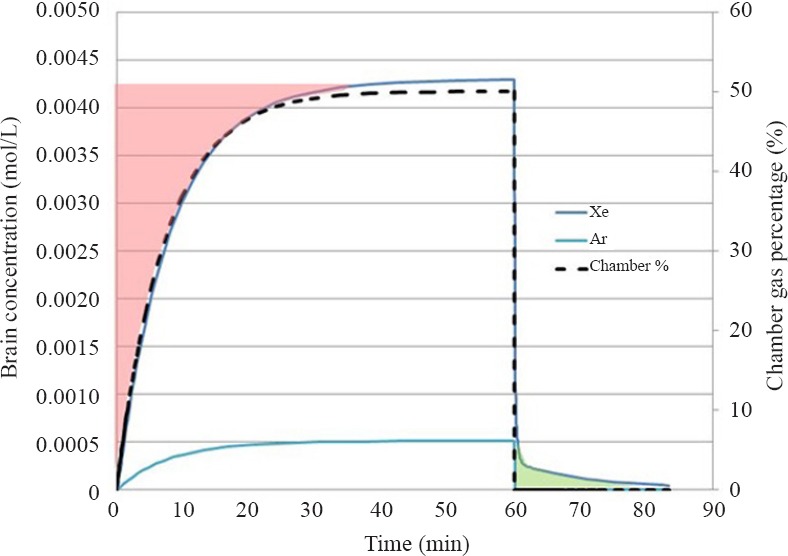
Chamber percentage and brain concentrations for Xe and Ar for in vivo experiment for gas delivery to a chamber containing one rat.
The area shaded in red on the plot represents the added AUC that would be assumed in the Xe experiment if wash-in were not taken into account resulting in about a 15% over estimate of the dose in this specific exposure that has been analyzed. Also note there is a wash-out dose for Xe (which is negligible for Ar) shaded in green that would be under estimated by about 1%, if the animal is removed from the chamber at 60 minutes.
In vitro analysis
The results of the analysis of the in vitro experiment supplying 50% of Xe or Ar to a test chamber holding a 96-well cell plate are summarized in Figure 4. Solutions for concentration at the bottom of the liquid column, C(0,t), using n = 10 terms of the Fourier series solution, for each gas can be seen in Figures 4A and 4B for water depths of 0.5 and 1 cm, respectively. A key point to note is that the depth of the liquid is an important parameter. For example, the time for Xe to completely saturate the water is about 8 hours for 0.5 cm and 30 hours for 1 cm. Also of importance is that the gas diffusion rates are quite different for the different gas species; the time for Ar to completely saturate the water is about 16 hours for L = 1 cm compared to the 30 hours for Xe. Results are tabulated in Table 2.
Figure 4.
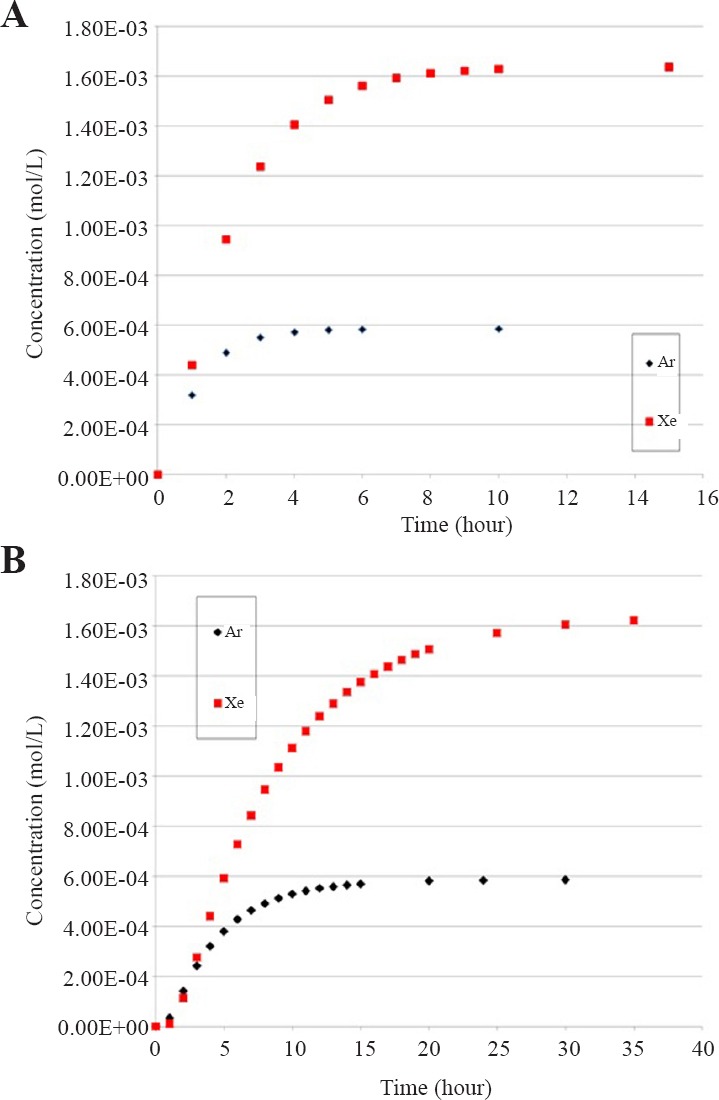
Concentration of xenon (Xe) or argon (Ar) at the level of the cell layer for a depth of water to the cells of 0.5 cm (A) and 1 cm (B).
Table 2.
Estimated time for saturation of water columns in the cell plate for each gas

DISCUSSION
The key conclusion resulting from these analyses is that the transport of inert gases during preclinical experiments can be important in determining the true dose as experienced at the site of action in an animal or to a cell. In the case of small animals in a chamber the key variable is the chamber wash-in time constant that is a function of the chamber volume and the supply gas flow rate. For cells covered by a liquid media the diffusion of gas through the liquid media is the dominant mechanism; such that liquid depth and the gas diffusion constant are the key parameters. In particular, the diffusion time, and thus actual dose, is a strong function of the liquid depth in each well. The time for diffusion can be more than 24 hours for Xe with a liquid depth of 1 cm but the rates are quite different for each gas. Thus, the actual dose to the cells should be assessed for each experiment.
A practical question to consider from the small animal experiment is whether to place the animal in the chamber before the gas flow begins or until after wash-in is complete? We would advise that unless special care is taken to put the animal in the chamber after wash-in without exposing the chamber gas to the external room atmosphere, experiments can be better controlled and characterized by starting the test gas with the animal in place and using equations 1 and 2 to determine the reduced dose compared to immediate gas administration.
Another practical question concerns the validity of the assumption of fully mixed gas in the chamber that is the basis of the mathematical analysis to arrive at equations 1 and 2. In brief, the fully mixed assumption will hold if the supply flow is turbulent. The relevant fluid dynamics parameter that predicts the presence of turbulence is the Reynolds number (Re),  where D is the inlet diameter, ρ and μ and μ are the gas density and viscosity (Table 3), respectively. For a free jet flow such as this the low limit for turbulence occurs at about Re > 10–30 (Bejan, 2013). For the in vivo example presented of 5 L/min supply the resulting Re for the 50% Ar and 50% Xe mixtures with oxygen are 1.4 × 10⁷ and 3.0 × 10⁷, respectively assuming a 0.5 cm diameter inlet. To cite an example that shows that this model is applicable, Meloni et al. (2014) have published data for 100% Xe (~2.5 L/min) wash-in to a 188.8 L (30 × 24 × 16 inches) animal chamber that held two rat cages and a total of four rats (~375 g). If the cages and rats occupy 20 L, or about 10% of the chamber volume, the theory predicted by equations 1 and 2 correlates very well with the published experimental measurements (Figure 5) for the first 15 minutes of Xe wash-in.
Table 3.
Gas property values at 37°C used for the calculation of the Reynolds number

Figure 5.
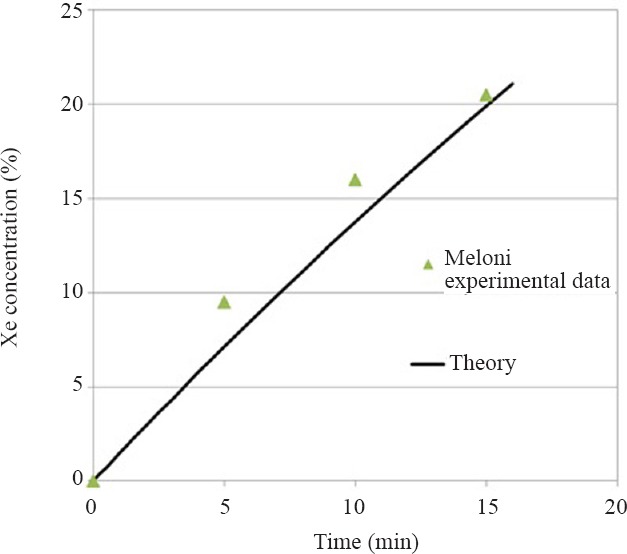
Theoretical predictions based on the fully mixed assumption of xenon (Xe) concentration in an animal chamber compared to experimental measurements (Meloni et al., 2014).
Note that the animals’ respiration in the chamber will be exchanging carbon dioxide for oxygen. This fact should not change the analysis we have provided for test gas concentration but does set a low threshold for gas flow rate to adequately provide oxygen and to remove the carbon dioxide from the chamber (Leavens et al., 1996; Wong, 2007).
It is assumed the gas absorbed by the rat in the in vivo analysis does not affect the chamber concentration; that is, the chamber wash-in is not coupled to the PK analysis. This assumption is justified by noting that about 6 molar Xe is supplied to the chamber during the 60 min exposure. From the PK calculations (by comparing inspired versus expired Xe concentrations), it is estimated that a rat would absorb ~3 × 10⁻³ mol in the in vivo example analyzed. Thus, only about 0.05% of the gas delivered would be absorbed, so the coupling is safely assumed to be negligible.
Large animal experiments using a ventilator and breathing circuit will also have a wash-in into their internal volumes (Dosch et al., 2009). However, the solution expressed as equations 1 and 2 cannot be directly applied as the details of the more complicated circuit must be investigated, or the wash-in time should be empirically determined.
A limitation of the cell plate analysis is the use of property values such as diffusion constant and solubility for water instead of those for the biological medium or the cells themselves. This points to an important need for the medical gas research community to determine these property values because solutes in these liquids can affect them (Lango et al., 1996).
One technique that is sometimes available to reduce the time to saturate the liquid media is to sparge, or bubble, the liquid with the test gas to saturate it before placing into the wells. This technique would especially be relevant for short time exposures. However, in practice this technique is often difficult requiring special consideration when using biological fluids because the gas flow tends to create foam (Ash et al., 2014).
Determining dose-response of gaseous compounds is challenging because of the complicated nature of gas transport. Nonetheless, it is important in the design of preclinical experiments that the kinetics of gas transport to cells or animals is accounted for. This paper has presented examples of the analysis of a typical in vitro cell experiment and an in vivo animal experiment to alert medical gas researchers to this issue and to provide guidance for the design of future experiments.
Footnotes
Conflicts of interest
There are no competing interests.
REFERENCES
- Ash SA, Valchev GI, Looney M, Ni Mhathuna A, Crowley PD, Gallagher HC, Buggy DJ. Xenon decreases cell migration and secretion of a pro-angiogenesis factor in breast adenocarcinoma cells: comparison with sevoflurane. Br J Anaesth. 2014;113(Suppl 1):i14–21. doi: 10.1093/bja/aeu191. [DOI] [PubMed] [Google Scholar]
- Bejan A. In: Convection Heat Transfer. Blanchard J, Tozer TN, Rowland M, editors. John Wiley & Sons; 2013. [Google Scholar]
- Blanchard J, Tozer TN, Rowland M. Pharmacokinetic perspectives on megadoses of ascorbic acid. Am J Clin Nutr. 1997;66:1165–1171. doi: 10.1093/ajcn/66.5.1165. [DOI] [PubMed] [Google Scholar]
- Coburn M, Sanders RD, Ma D, Fries M, Rex S, Magalon G, Rossaint R. Argon: the ‘lazy’ noble gas with organoprotective properties. Eur J Anaesthesiol. 2012;29:549–551. doi: 10.1097/EJA.0b013e328357bfdd. [DOI] [PubMed] [Google Scholar]
- Deng J, Lei C, Chen Y, Fang Z, Yang Q, Zhang H, Cai M, Shi L, Dong H, Xiong L. Neuroprotective gases--fantasy or reality for clinical use? Prog Neurobiol. 2014;115:210–245. doi: 10.1016/j.pneurobio.2014.01.001. [DOI] [PubMed] [Google Scholar]
- Dosch MP, Loeb RG, Brainerd TL, Stallwood JF, Lechner S. Time to a 90% change in gas concentration: a comparison of three semi-closed anesthesia breathing systems. Anesth Analg. 2009;108:1193–1197. doi: 10.1213/ane.0b013e3181949afd. [DOI] [PubMed] [Google Scholar]
- Harris AR, Peter L, Bellis J, Baum B, Kabla AJ, Charras GT. Characterizing the mechanics of cultured cell monolayers. Proc Natl Acad Sci U S A. 2012;109:16449–16454. doi: 10.1073/pnas.1213301109. [DOI] [PMC free article] [PubMed] [Google Scholar]
- Hollig A, Schug A, Fahlenkamp AV, Rossaint R, Coburn M. Argon: systematic review on neuro- and organoprotective properties of an “inert”. Int J Mol Sci. 2014;15:18175–18196. doi: 10.3390/ijms151018175. [DOI] [PMC free article] [PubMed] [Google Scholar]
- Katz I, Caillibotte G, Martin AR, Arpentinier P. Property value estimation for inhaled therapeutic binary gas mixtures: He, Xe, N2O, and N2 with O2. Med Gas Res. 2011;1:28. doi: 10.1186/2045-9912-1-28. [DOI] [PMC free article] [PubMed] [Google Scholar]
- Katz I, Murdock J, Palgen M, Pype J, Caillibotte G. Pharmacokinetic analysis of the chronic administration of the inert gases Xe and Ar using a physiological based. Med Gas Res. 2015;5:8. doi: 10.1186/s13618-015-0029-z. [DOI] [PMC free article] [PubMed] [Google Scholar]
- Lango T, Morland T, Brubakk AO. Diffusion coefficients and solubility coefficients for gases in biological fluids and tissues: a review. Undersea Hyperb Med. 1996;23:247–272. [PubMed] [Google Scholar]
- Langston JW, Toombs CF. Defining the minimally effective dose and schedule for parenteral hydrogen sulfide: long-term benefits in a rat model of hindlimb ischemia. Med Gas Res. 2015;5:5. doi: 10.1186/s13618-015-0027-1. [DOI] [PMC free article] [PubMed] [Google Scholar]
- Leavens TL, Moss OR, Turner MJ, Janszen DB, Bond JA. Metabolic interactions of 1,3-butadiene and styrene in male B6C3F1 mice. Toxicol Appl Pharmacol. 1996;141:628–636. doi: 10.1006/taap.1996.0329. [DOI] [PubMed] [Google Scholar]
- Lockwood G. Theoretical context-sensitive elimination times for inhalation anaesthetics. Br J Anaesth. 2010;104:648–655. doi: 10.1093/bja/aeq051. [DOI] [PubMed] [Google Scholar]
- Meloni EG, Gillis TE, Manoukian J, Kaufman MJ. Xenon impairs reconsolidation of fear memories in a rat model of post-traumatic stress disorder (PTSD) PloS one. 2014;9:e106189. doi: 10.1371/journal.pone.0106189. [DOI] [PMC free article] [PubMed] [Google Scholar]
- Spaggiari S, Kepp O, Rello-Varona S, Chaba K, Adjemian S, Pype J, Galluzzi L, Lemaire M, Kroemer G. Antiapoptotic activity of argon and xenon. Cell Cycle. 2013;12:2636–2642. doi: 10.4161/cc.25650. [DOI] [PMC free article] [PubMed] [Google Scholar]
- Tancredi FB, Lajoie I, Hoge RD. A simple breathing circuit allowing precise control of inspiratory gases for experimental respiratory manipulations. BMC Res Notes. 2014;7:235. doi: 10.1186/1756-0500-7-235. [DOI] [PMC free article] [PubMed] [Google Scholar]
- Wilhelm E, Battino R, Wilcock RJ. Low-pressure solubility of gases in liquid water. Chem Rev. 1977;77:219–262. [Google Scholar]
- Winkler DA, Thornton A, Farjot G, Katz I. The diverse biological properties of the chemically inert noble gases. Pharmacol Ther. 2016;160:44–64. doi: 10.1016/j.pharmthera.2016.02.002. [DOI] [PubMed] [Google Scholar]
- Wong BA. Inhalation exposure systems: design, methods and operation. Toxicol Pathol. 2007;35:3–14. doi: 10.1080/01926230601060017. [DOI] [PubMed] [Google Scholar]


