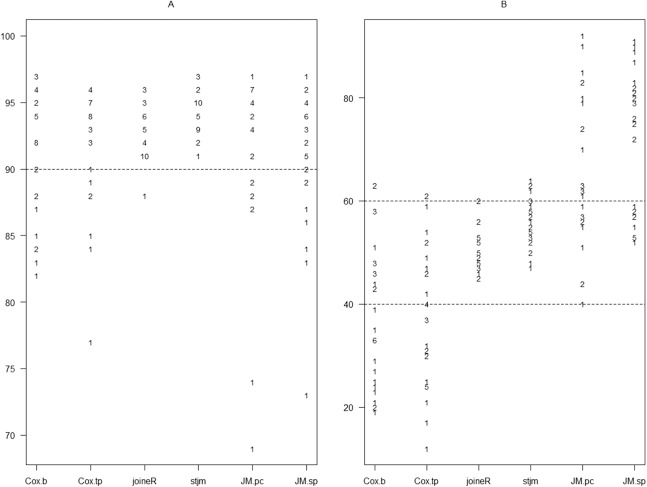
Figure 2. Graphical presentation of the results in Table 2.
(A) Coverage of 95% confidence intervals. (B) Percentage of estimates less than the true parameter value out of the 100 estimates for each set of simulation. The points are plotted as numbers with each number indicating the number of simulation sets (out of 32) with the corresponding percentage. Refer to Fig. 1 for other abbreviations.

