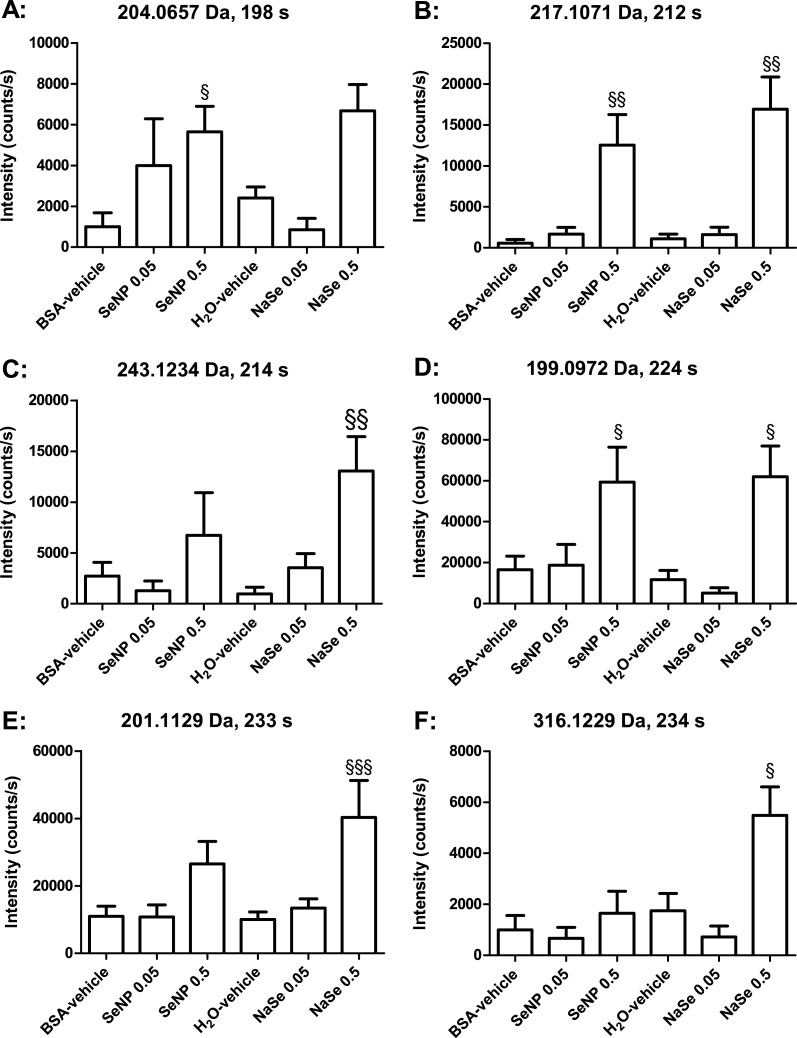
Figure 3. Bar graphs of individual metabolites determinedby LC-MS in negative ionization mode.
SeNP designates Se nanoparticles, and NaSe designates sodium selenite. The data are the mean values, and the bars indicate SEM. The data were statistically tested as BSA-vehicle vs. Se nanoparticles at 0.05 and 0.5 mg Se/kg bw/day and as H2O-vehicle vs. sodium selenite at 0.05 and 0.5 mg Se/kg bw/day. The statistical tests were Kruskal–Wallis with Dunn’s post-test for data that were not normally distributed (§ designates p < 0.05, §§ p < 0.01 and §§§ p < 0.001).

