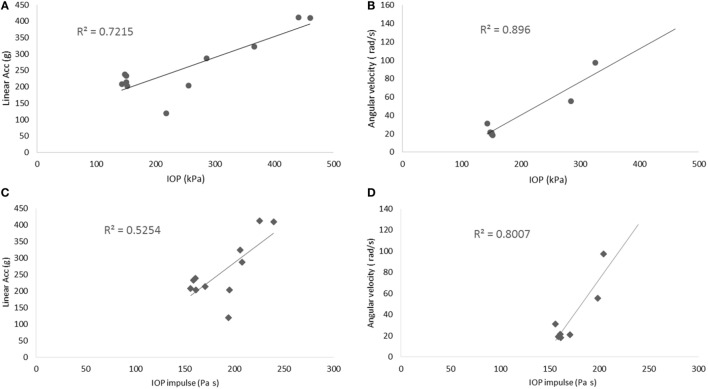
Figure 10.
Scatter plots of the motion of the head. (A,B) show the relationship between the peak IOP (abscissa) and the resultant linear acceleration (ordinate, left graph), or the resultant angular velocity (ordinate, right graph). Similarly, (C,D) show the relationship between the IOP impulse (abscissa) and the resultant linear acceleration (ordinate, left graph), or the resultant angular velocity (ordinate, right graph). These variables correlated well with the peak IOP in linear regression models.

