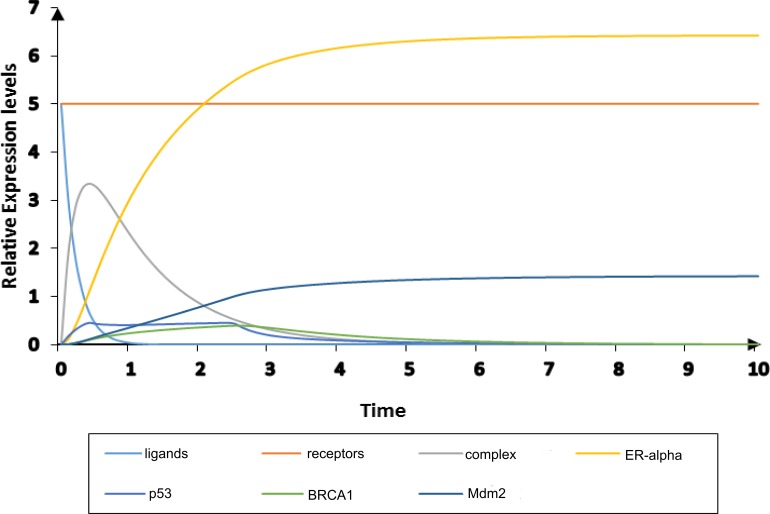
Figure 10. Simulation of diseased HPN model.
The simulated graph shows time on X-axis and relative expression levels of entities on Y-axis. The pathological behavior of ER-α associated BRN is observed by the down-regulate expressions of TSGs; p53, BRCA1 and Mdm2 (cyan, green and navy) with relatively increased the activity of ER-α (yellow).

