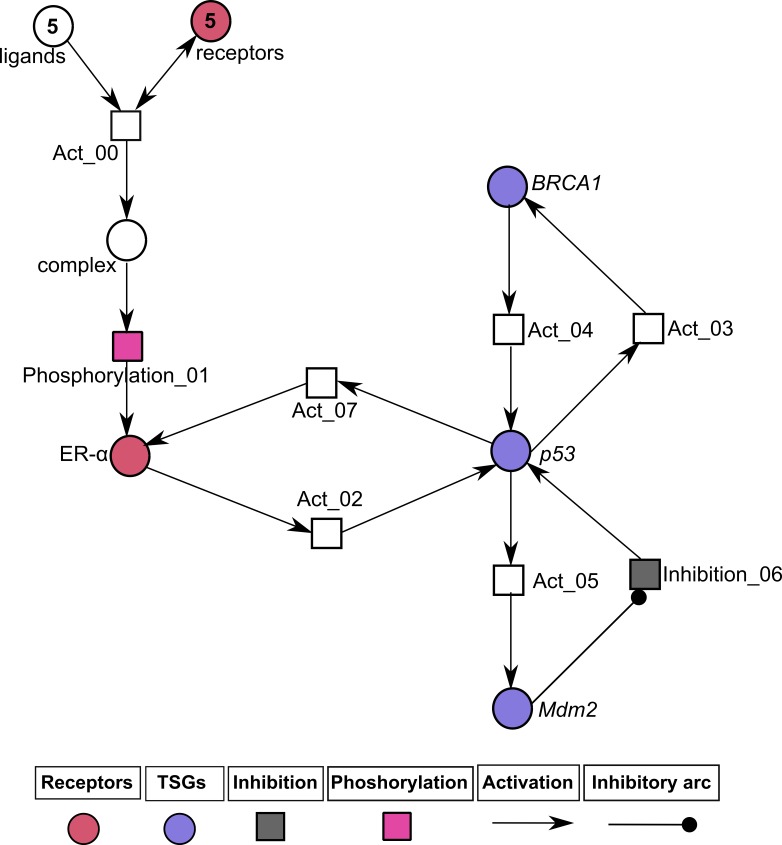
Figure 7. Illustration of the normal pathway of ER-α associated Hybrid Petri Net (HPN) model.
In this PN, circles represent standard places that exhibit the behavior of ligands (IGF-1, EGF), hormonal receptors (IGF-1R, EGFR and ER-α) and TSGs (BRCA1, p53 and Mdm2), while the squares represent continuous transitions to demonstrate the processes of activation, inhibition and phosphorylation. Directed arrows represent activation signal coming from standard places and going towards continuous transitions. The inhibitory arc represents an inhibition signal which stops signal coming from standard places towards continuous transitions. The rate of mass action for all continuous transitions is taken as 1. The ligands (IGF-1, EGF) and the membrane receptors (IGF-1R/EGFR) are given with an arbitrary token number of 5.

