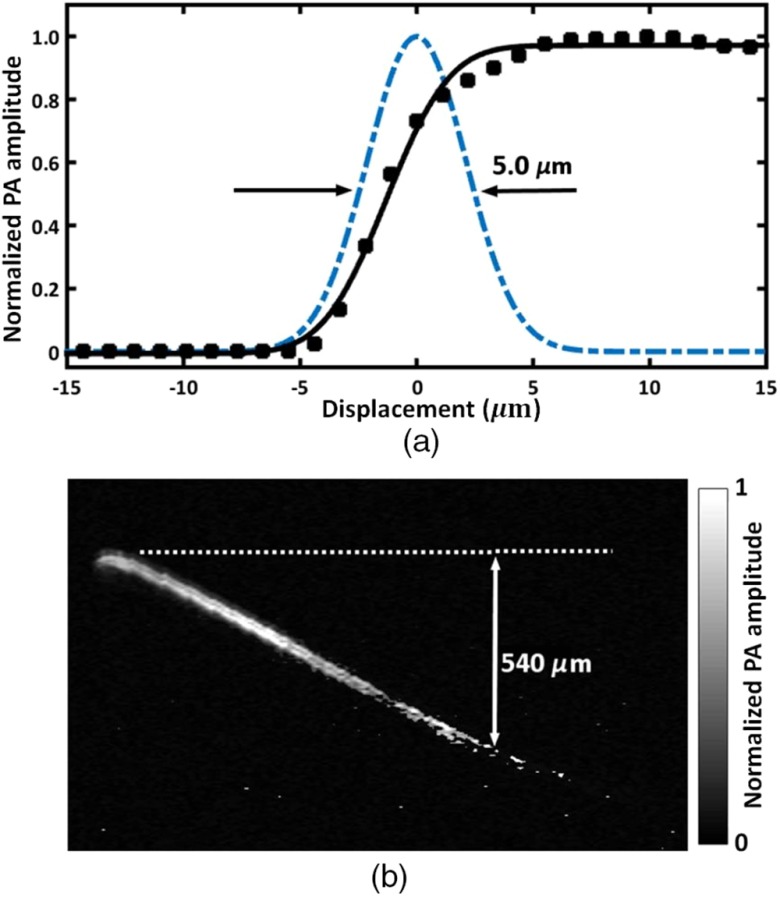
Fig. 2.
Characteristics of the handheld OR-PAM probe. (a) Lateral resolution measurement by imaging a sharp edge. Solid squares: the PA amplitude when the laser beam was scanned across the edge. Solid curve: the fit of the measured data to an error function. Dashed line: the extracted Gaussian-shaped line spread function. (b) Penetration depth measured by a hair embedded in an optical scattering medium mimicking skin tissue. The acoustic attenuation has been compensated for by multiplying the PA signal by a depth-dependent exponential correction factor. The gray bar shows the normalized PA signal amplitude.

