Fig. 5.
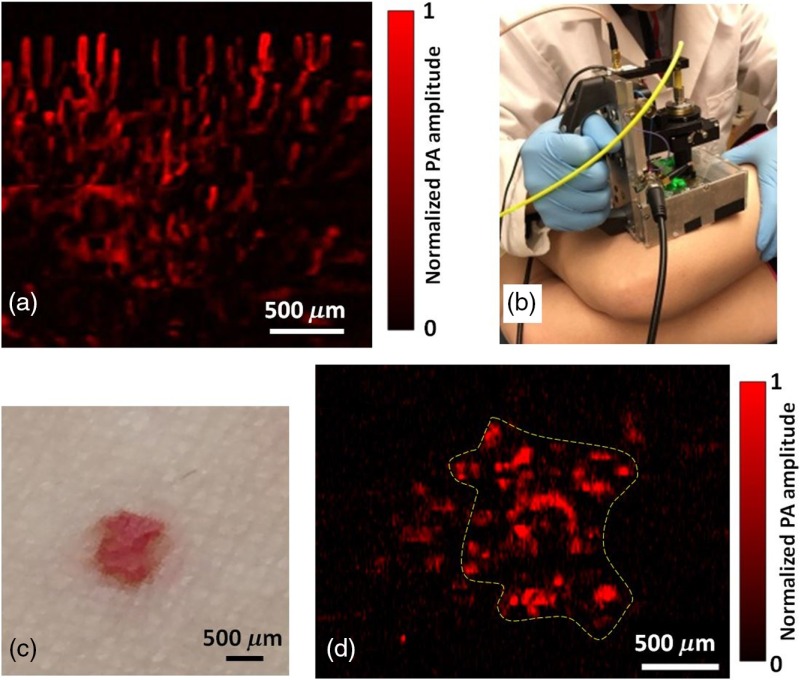
OR-PAM of the human skin by the handheld probe. (a) OR-PAM image of capillaries in a cuticle. (b) Photograph of the OR-PAM handheld probe imaging a red mole on a volunteer’s leg. (c) Photograph of the mole. (d) OR-PAM image of the mole. The color bar shows the normalized PA signal amplitude.

