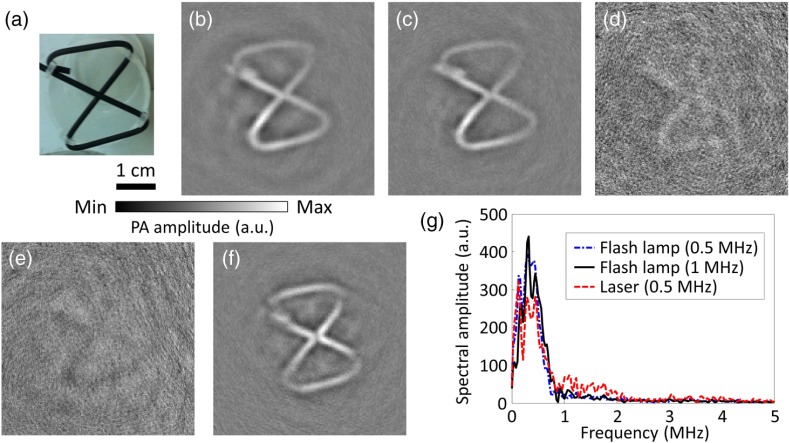
Fig. 3.
PACT images and frequency spectra of the pure latex cord acquired using laser or xenon flash lamp illumination and ultrasonic transducers with varied center frequencies. (a) Photograph of the pure latex cord. PACT images acquired with flash lamp illumination and (b) 0.5, (c) 1.0, (d) 3.5, and (e) 5.0 MHz ultrasonic transducers. (f) PACT image acquired with laser illumination and the 0.5-MHz ultrasonic transducer. (g) Averaged frequency spectra of the raw PA signals acquired with the laser and flash lamp illumination.

