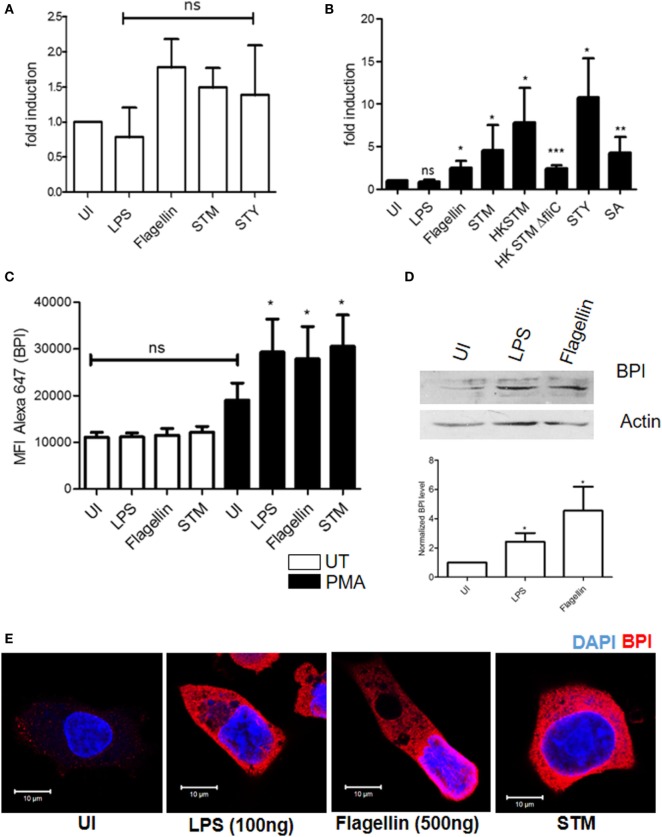
Figure 2.
Regulation of BPI expression in human monocytes/macrophages. U937 monocytes/macrophages were exposed to indicated inflammatory stimuli/pathogen. (A,B) Total RNA was isolated and BPI expression was investigated by real-time PCR [n = 5 (SD)]. (C) BPI expression was checked by flow cytometry [n = 3 (SD)]. (D) Total protein was isolated from U937 macrophage, and BPI levels were analyzed by western blot (n = 4). Bottom: quantitative evaluation of the relative BPI expression normalized to β-actin intensity. (E) Cells were PFA fixed and stained for BPI (red) and nuclei (blue). Cells were imaged by confocal microscopy (n = 6). Key: ***p < 0.001, **p < 0.005, *p < 0.05; ns, not significant.

