Figure 5.
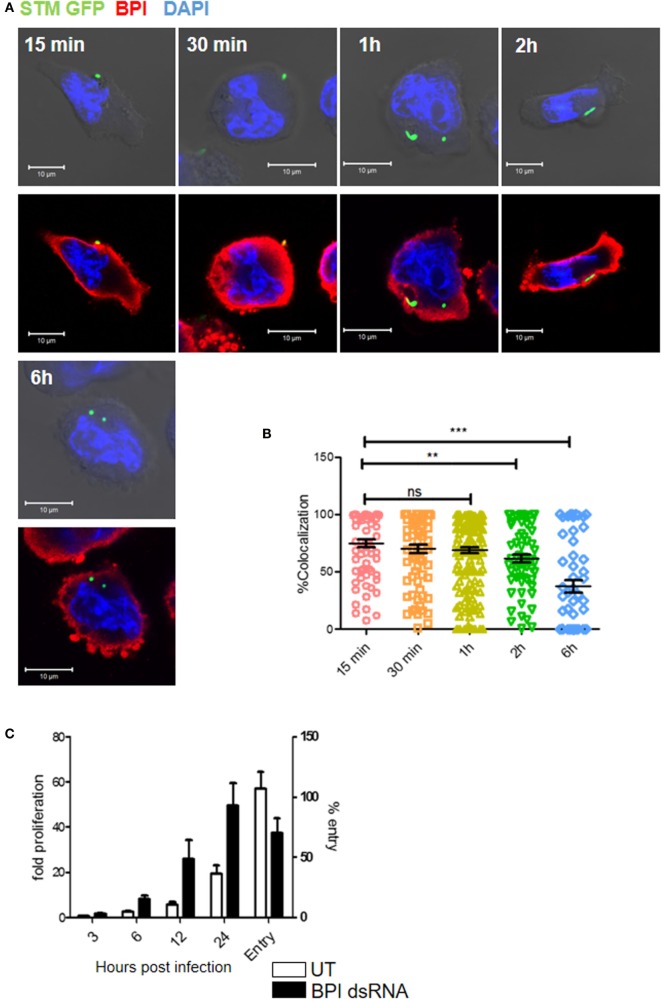
Time-course analysis of BPI interaction with Salmonella Typhimurium in U937 macrophages during the course of infection. (A) U937 macrophages were infected with STM–GFP (green) at an MOI of 50. Cells were fixed with PFA at the indicated time points and stained for BPI (red) and nuclei (blue) (n = 3). Panel shows representative bright field and merged images for each time point. (B) Quantification of colocalization of BPI with STM–GFP [n = 3 (SD)]. (C) U937 macrophages were infected with STM–GFP at an MOI of 10. Bacterial entry was quantified by plating the cell lysates after 30 min post-infection. Bacterial replication was quantified by plating the cell lysates at indicated time points and was normalized to the CFU at 1 h post-infection. Fold proliferation and percentage survival were calculated [n = 3 (SD)]. Key: ***p < 0.001, **p < 0.005, *p < 0.05; ns, not significant.

