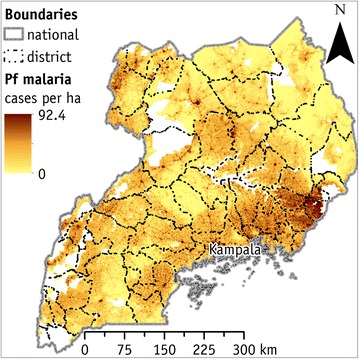
Fig. 2.

The modelled number of falciparum malaria cases per year and per hectare in Uganda. Integration between the spatial distributions of falciparum malaria incidence (falciparum malaria cases × 1000 people) and of population density model (people × hectare). East region has the lowest number of cases
