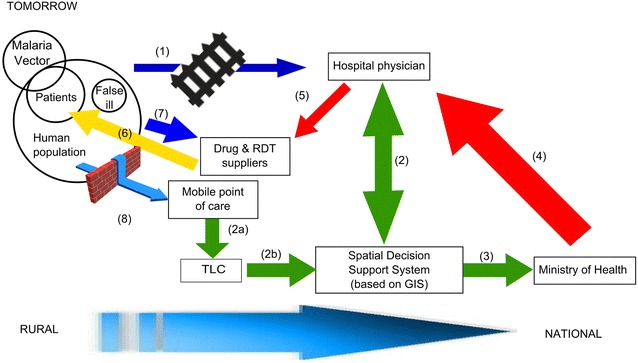
Fig. 6.

An hypothesis for a future malaria management process after the implementation of m-Health approach. Potential benefit of the introduction of m-Health approach and GIS to manage malaria in Uganda. Blue arrows represent physical movement; red arrows decision fluxes, green arrows information and data flow, and yellow arrow drugs supply. Size of the arrows gives a semi-quantitative measure of the increase of flow of people, material, data, information and decision. Each step (numbers in brackets) is described in the text
