
Fig. 1.
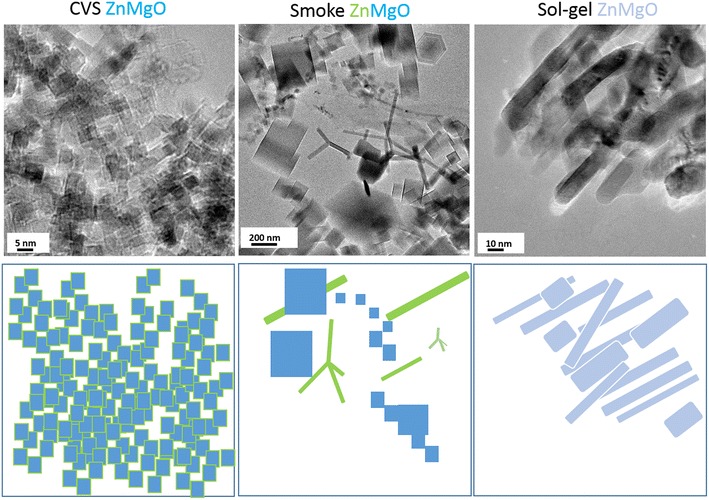
Various shapes of ZnMgO nanoparticles produced by dufferent synthesis routes. TEM images of ZnMgO nanoparticles obtained via three different synthesis methods at the Paris Institute of Nanosciences and the illustrations of the corresponding crystal forms. All powders were kept at P < 10−5 mbar after the synthesis while the microscopic measurements were performed on bare powders in order to analyze the initial morphology resulting from the corresponding fabrication route. Surface segregation of Zn-atoms is highlighted by green color surrounding MgO cubes in the illustration representing CVS method