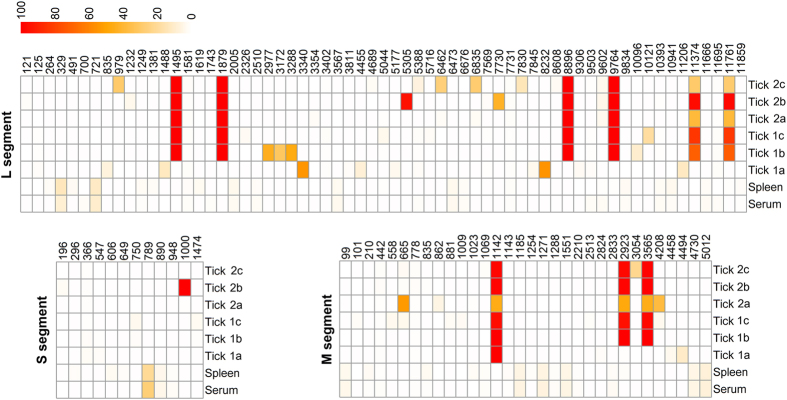
Figure 3. Heat map showing the distribution of the SNVs (frequencies >1%) for all samples from mammalian and tick hosts.
The colored bar indicates the percentage of the variation (red equals 100%, and the white equals 0). Newly molted ticks are designated 1a, 1b, and 1c, while 1 yr. old ticks are labeled 2a, 2b, and 2c.

