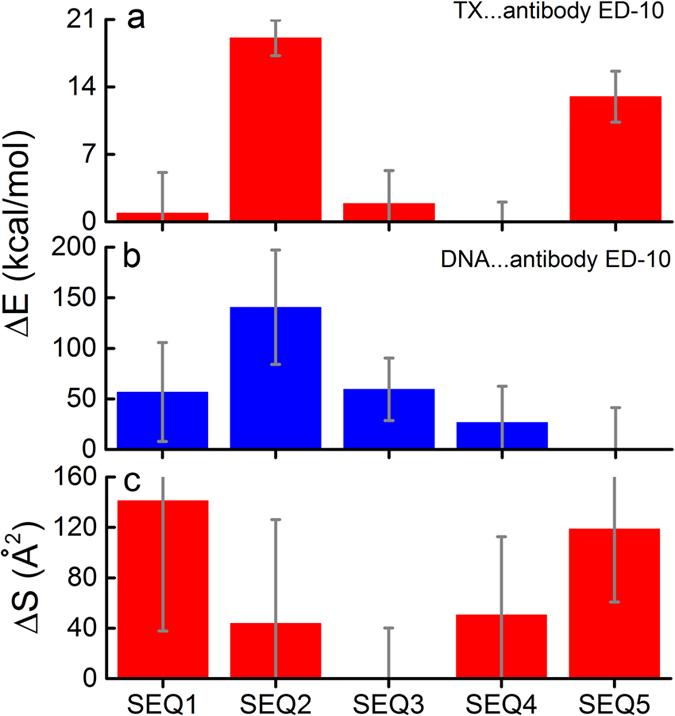
Figure 2. Bar charts showing the results of molecular modelling.

(a) Bar charts showing the differences in the binding energy between the antibody ED-10 and residues 10 and 11 of oligonucleotides SEQ1-SEQ5, using the SEQ4 value as a reference point (−65.1 ± 2.1 kcal/mol). The symbol X in the legend is used to denote different bases which are either cytidine (SEQ1, SEQ4 and SEQ5), adenosine (SEQ2), guanosine (SEQ3). (b) Bar chart showing the differences in the binding energy between the antibody and the entire oligonucleotides (SEQ1-SEQ5), using the SEQ5 value as a reference point (−578.9 ± 83.0 kcal/mol). (c) Bar chart showing the differences in the contact area between the antibody ED-10 and the five oligonucleotides (SEQ1-SEQ5) using the SEQ3 value as a reference point (630.2 Å2). It should be noted that in all three graphs the standard deviation (SD) is used as error bars.
