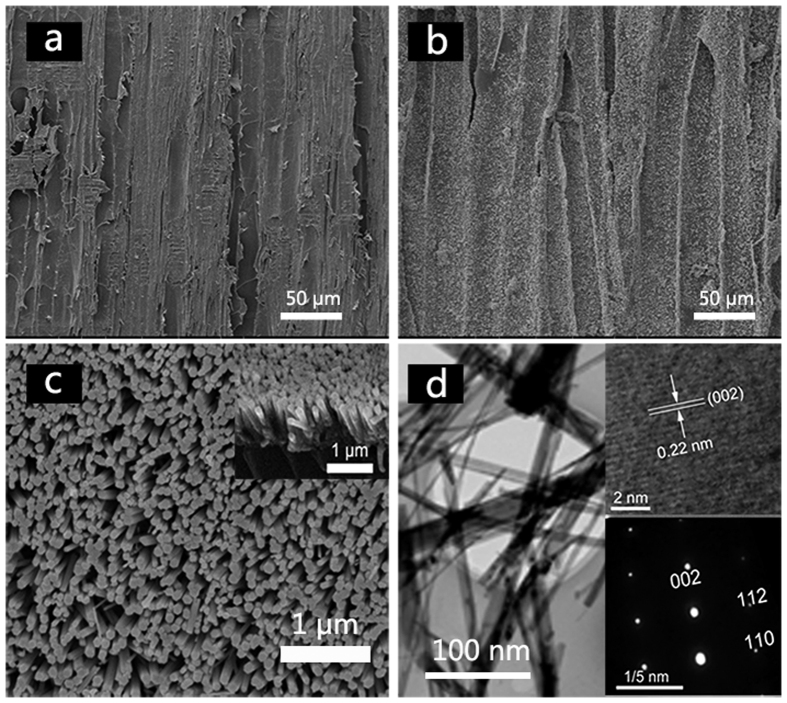
Figure 2.
SEM images of (a) the surface of the pristine wood, (b) the surface of the ZNA-treated wood with low-magnification, (c) the surface of the ZNA-treated wood with high-magnification, the inset image is the cross section of ZNAs, (d) TEM images of ZNAs peeled off from the wood surface. The inset images were the corresponding HRTEM image (top right corner) and SAED pattern (right bottom).

