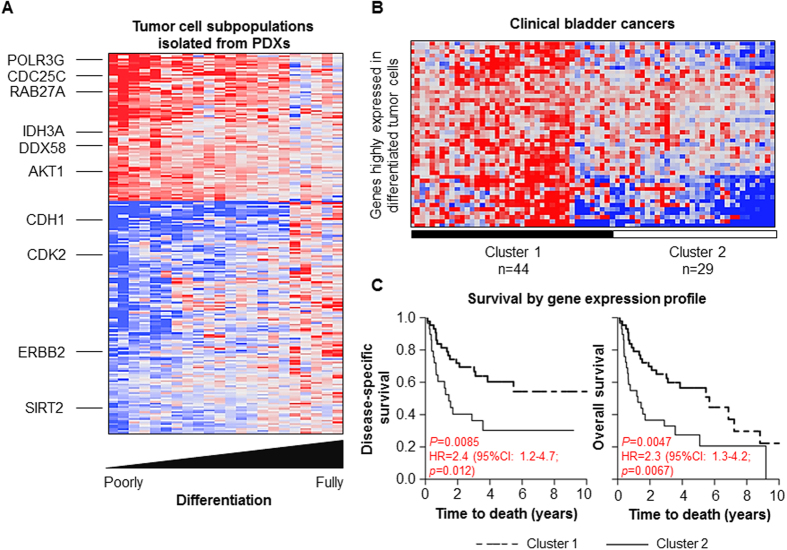
Figure 2. Gene signature associated with bladder tumor cell differentiation and poor prognosis in patients with bladder cancer.
(A) Heat map showing expression of 88 correlated and 136 anti-correlated genes associated with tumor cell differentiation. Five independent PDXs were flow sorted into respective tumor cell subpopulations and were available for microarray gene expression analyses. Red color indicates high expression, while blue color indicates low expression. (B) Hierarchical clustering of differentially expressed tumor cell differentiation-associated genes identified two groups of patients from the MD Anderson Cancer Center data set9 (C). Kaplan-Meier survival curves for patient clusters stratified by tumor cell differentiation-associated gene expression. Time to death was calculated as the interval between radical cystectomy and date of death or last follow-up. P-values were determined using log-rank tests. HR, hazard ratio; 95% CI, confidence interval; P-value determined using univariate Cox proportional hazard analysis.

