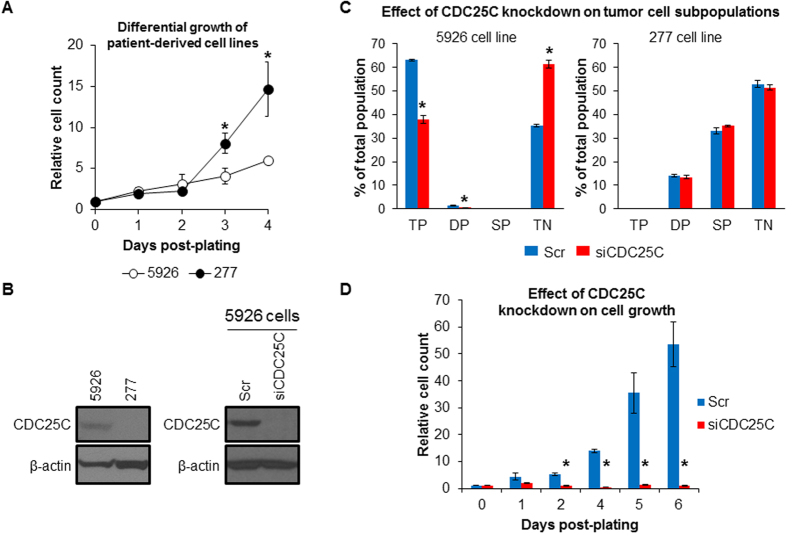
Figure 3. CDC25C promotes tumor cell dedifferentiation and growth.
(A) Differential growth of 5926 (predominantly basal cells) and 277 (predominantly fully differentiated cells) cell lines in vitro. Cell count was manually determined using a hemocytometer for four biological replicates per sample. Relative cell count was determined by normalization to day 0 values. (B) Western blot analysis of CDC25C protein expression in parental 5926 and 277 cell lines and in 5926 cells after treatment with siRNA against CDC25C (siCDC25C) or a scrambled control (Scr). β-actin protein level served as a loading control. (C) Flow cytometric analysis of bladder tumor cell subpopulations after treatment of 5926 and 277 cells with siRNA against CDC25C or a scrambled control. TP, triple-positive (basal); DP, double-positive (intermediate); SP, single-positive (differentiated); TN, triple-negative (fully differentiated). (D) Effect of CDC25C gene suppression on 5926 cell growth. Relative cell count was determined by normalization to day 0 values. Error bars denote standard error of mean. P-values were determined using 2-tailed Student’s t-test. Asterisks denote P-values ≤ 0.05.

