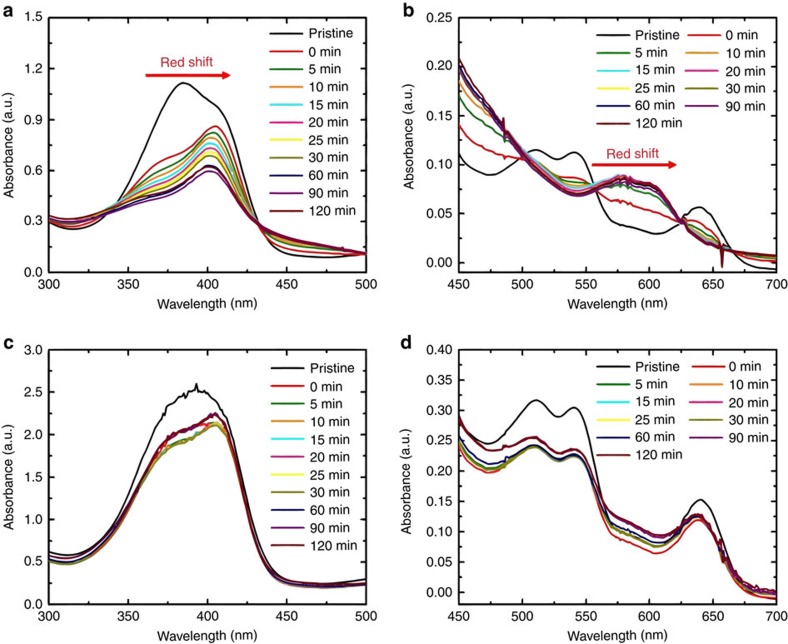
Figure 4. Chemical states of heme molecule by binding with oxygen species.
Ultraviolet–vis spectra of heme-containing electrolytes with increasing time after the injection of KO2 solution; (a) TEGDME+Heme (Soret band region), (b) TEGDME+Heme (Q-band region), (c) 1 M LiClO4+TEGDME+Heme (Soret band region), (d) 1 M LiClO4+TEGDME+Heme (Q-band region).

