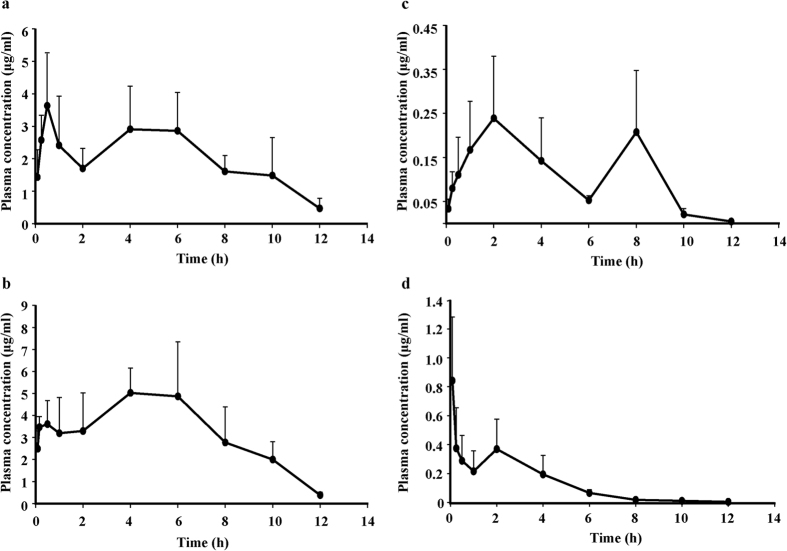
Figure 4.
Mean plasma concentration-time curve of quercetin-3-O-β-glucuronide (Q3G) after oral administration of 100 mg/kg (a) quercetiin (QUE) (b) or QUE respectively in rats. (n = 5, mean ± SD). Mean plasma concentration-time profile of Q3G after oral administration of 100 mg/kg Q3G (c) or 100 mg/kg QUE (d) respectively in rats. (n = 5, mean ± SD).

