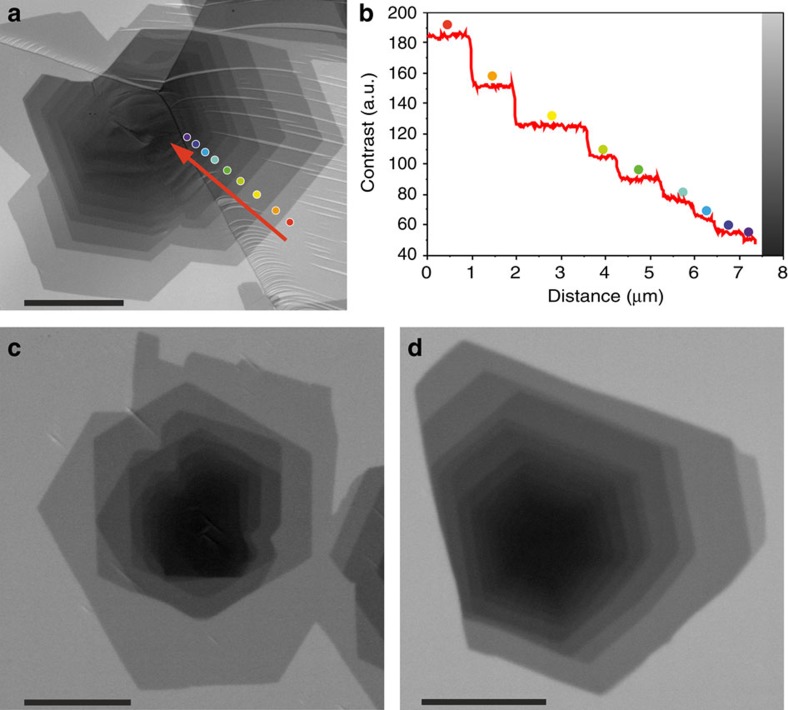
Figure 1. Real-time characterization of graphene sheets.
(a,b) The ESEM image (a) shows a FLG stack. Along the red arrow, the brightness in the secondary electron image changes with each additional layer. (b) Line plot showing the change in contrast along the red arrow in (a). Up to nine layers can be distinguished within the contrast range. The different coloured dots along the arrow are intended to assist the assignment between layer number and grey value. Note that the lightest shade marked by a red dot corresponds to Pt covered by SLG. (c) Vertical layer stacking showing a 30° rotation between successive layers. (d) Hexagonal shape distorted by interaction with the Pt surface in ABA or ABC stacked FLG. Scale bars, 5 μm (a); 2 μm (c,d).

