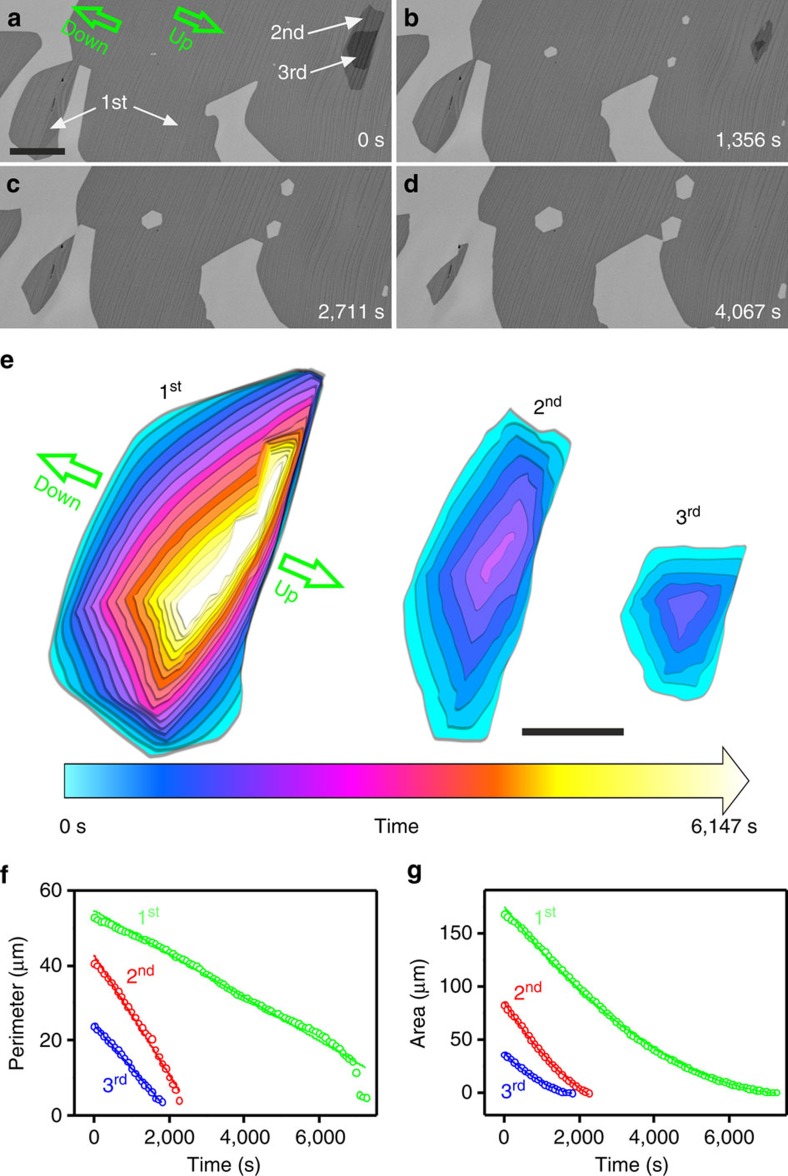
Figure 2. Evolution of isothermal CVD grown graphene layers during H2 etching.
(a–d) Time-lapse image series showing the etching of SLG and the topmost layers in BLG and TLG. (e) Shape evolution of the respective layers during etching, reproduced as colour-coded superposition of outlines that were abstracted from images recorded at 3,600 s intervals (Supplementary Movie 2). (f) Evolution of the perimeters of the first, second and third layers in a, with corresponding linear fits. (g) Evolution of the area of the first, second and third layers in a, with corresponding quadratic fits. The green arrows in a,e indicate the up-step and down-step directions of Pt terraces. The scale bars in a,e measure 10 and 5 μm, respectively.

