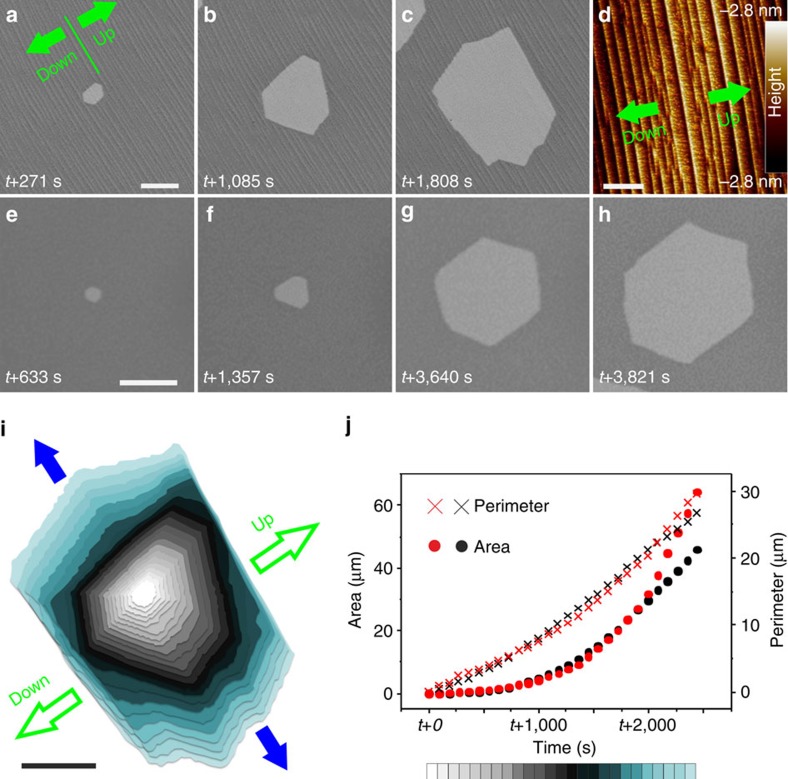
Figure 3. The anisotropic etching of vacancy islands.
(a–c) In situ SEM images recorded at 900 °C during H2 etching showing the evolution of etch pits on a faceted Pt surface. t corresponds to the start time of dosing H2 into the chamber. (d) AFM image recorded from the same Pt grain imaged in a,b. The graphene covered surface is characterized by graphene-induced Pt step bunching and surface reconstruction. (e–h) In situ SEM images recorded at 900 °C during H2 etching showing the evolution of a vacancy island on a flat Pt surface. (i) Time-dependent change of the size and shape of the vacancy island shown in a–c. The superimposed shapes were extracted from frames recorded at 180 s intervals. Green arrows indicate the up-/downward direction of steps. Blue arrows indicate the direction of elongation along the terraces. (j) Line plots showing the evolution of the perimeter and area as a function of etching time, black symbols correspond to etching on the stepped Pt surface and red symbols to the case of the flat Pt surface. The scale bars in a,d,e and i measure 2 μm, 200 nm, 5 μm and 2 μm, respectively.

