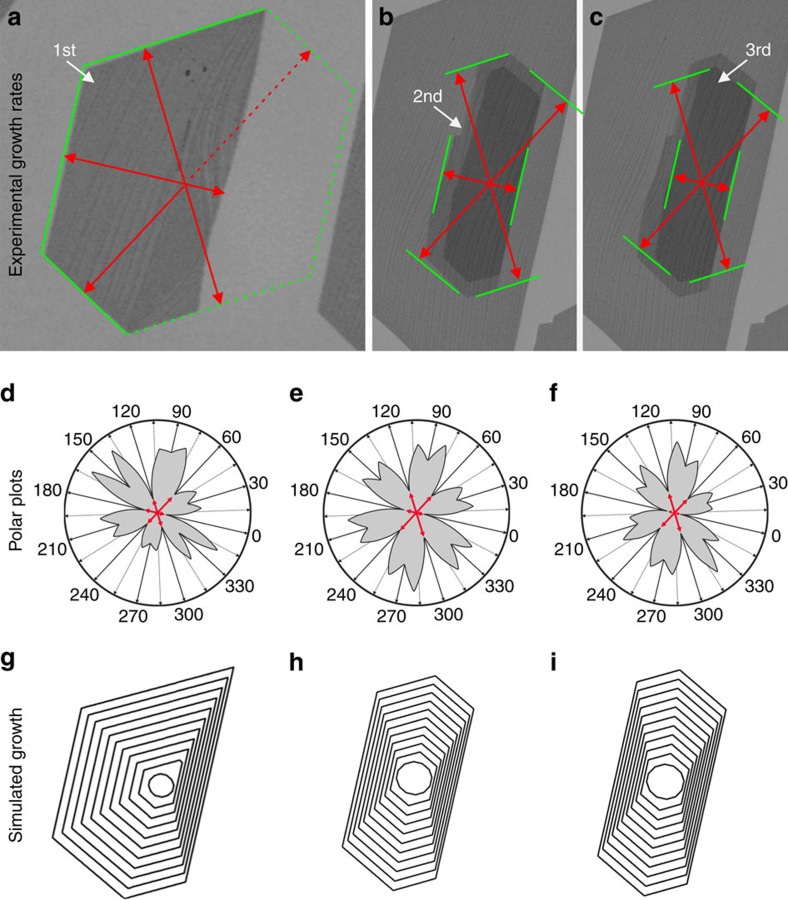
Figure 5. Simulated growth.
(a–c) Final shapes of the graphene flakes before initiation of the graphene etching. The outlines of the flakes indicate termination by zigzag edges. (d–f) Polar plots obtained using the experimental growth rates (corresponding to the six inner most points in the polar plots). (g–i) Simulated kinetic Wulff construction of growth.

