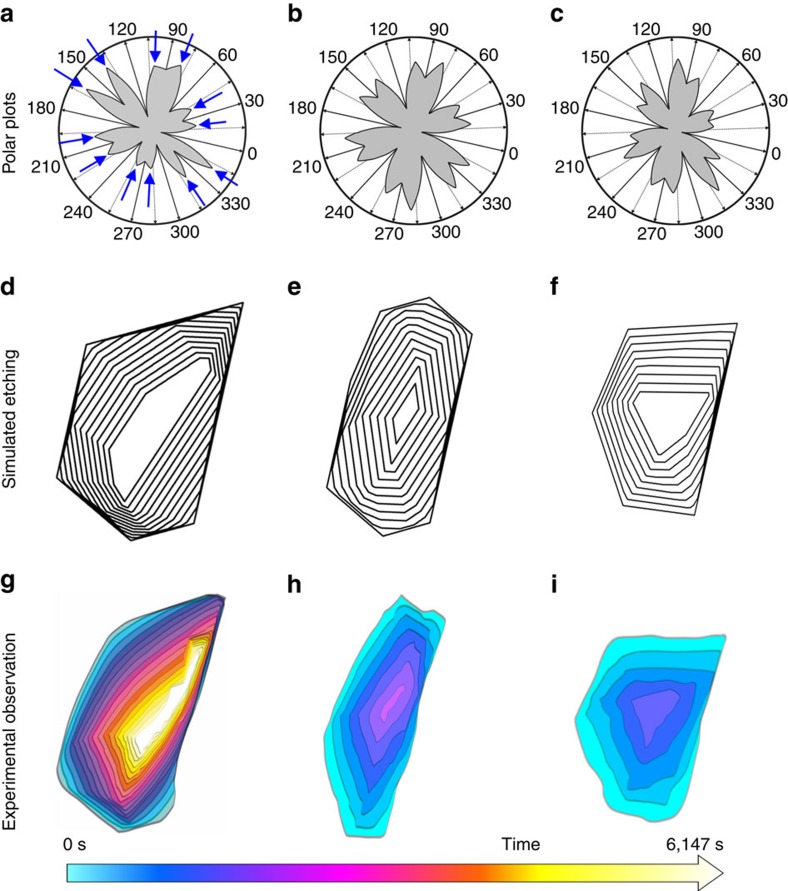
Figure 6. Simulated etching.
(a–c) The same polar plots as in Fig. 5, but this time, the fastest directions indicated by blue arrows in a determine the shape evolution. (d–f) Simulated kinetic Wulff construction of the etching process. (g–i) Shape evolution of the first, second and third layers during etching as observed in the ESEM.

