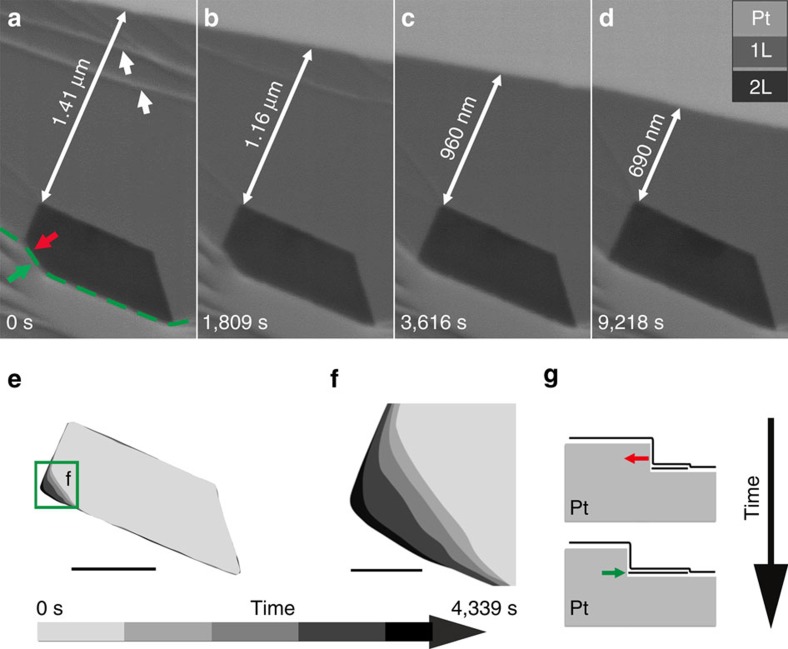
Figure 8. Bilayer growth by C segregation during cooling.
(a–d) Time-lapse image series showing simultaneous etching of the topmost layer and growth of the covered layer underneath. (e) Contours of the ALG domain at different times. (f) Magnified region of e, showing growth by C segregation from a substrate step edge. (g) Schematic view showing the retraction of the Pt step edge and growth of a buried carbon layer. Red and green arrows in a,g indicate the direction of the Pt step edge movement and C precipitation, respectively. Scale bars in e,f measure 500 and 100 nm, respectively.

