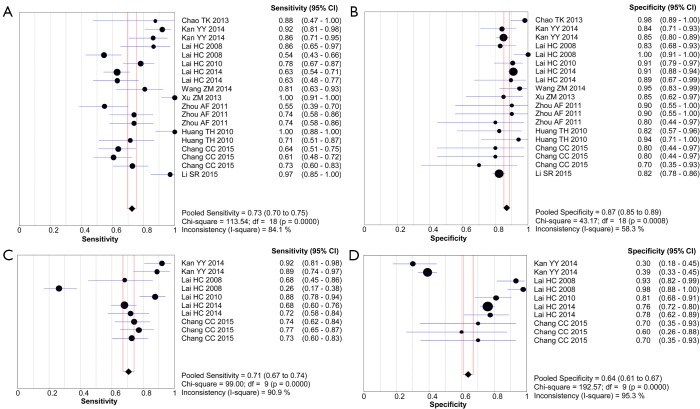
Figure 3.
Forest plots of the pooled sensitivity and specificity for PAX1 and SOX1 methylation. (A) Sensitivity for PAX1; (B) specificity for PAX1; (C) sensitivity for SOX1; (D) specificity for SOX1. Only the first author of each study is given. Sensitivity and specificity are given with 95% confidence intervals (CIs). PAX1, paired boxed gene 1; SOX1, sex determining region Y-box 1.

