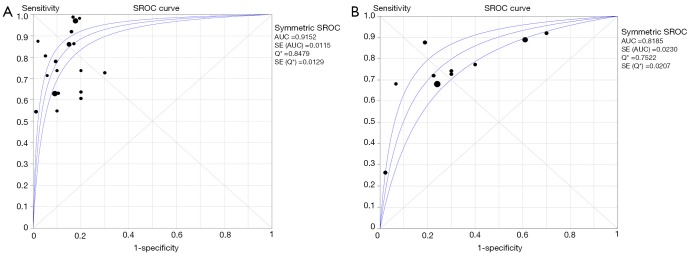
Figure 4.
SROC curve of the pooled PAX1 and SOX1 methylation tests. Sample size is indicated by the size of the square. The regression SROC curve indicates the overall diagnostic accuracy. (A) PAX1 methylation; (B) SOX1 methylation. AUC, area under curve; SENS, sensitivity; SPEC, specificity; SROC, summary receiver operator curve; PAX1, paired boxed gene 1; SOX1, sex determining region Y-box 1.

