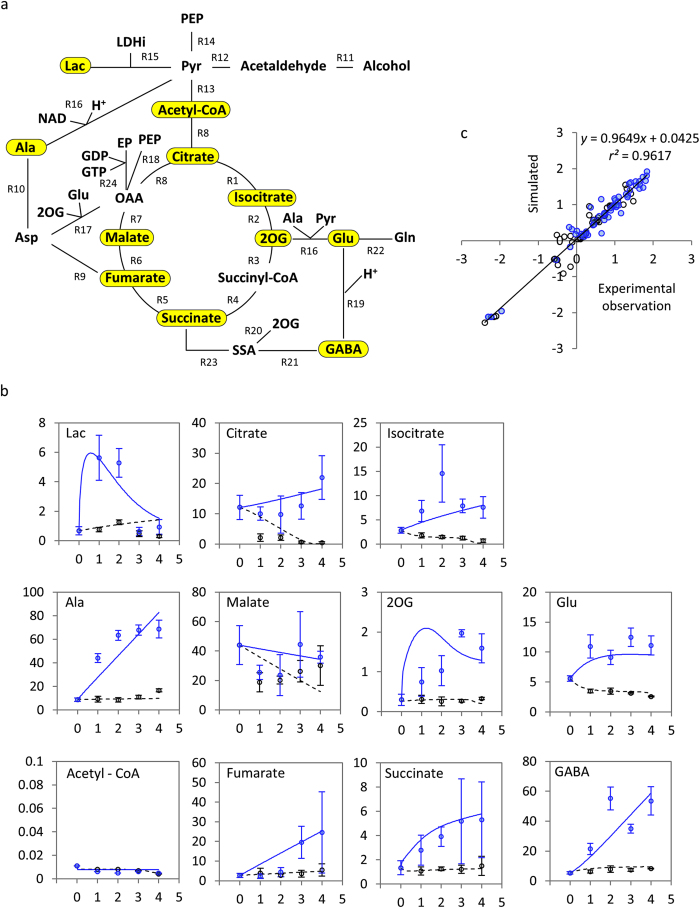
Figure 1. Soybean metabolic system model.
(a) Schematic of soybean metabolic system. ‘Rx’ indicates reaction number in the metabolic data (reaction details are documented in Supplementary Table S1). Eleven fitting-target metabolites are shown in yellow. (b) Temporal profiles of experimentally measured and simulated amounts of metabolites without perturbations. Black and blue circles indicate experimentally measured amounts of metabolites in the control and flooding treatment, respectively. Error bars show standard error. Black dashed and blue solid lines indicate simulated amount of metabolites in the control and flooded models, respectively. Horizontal and vertical axes show days after the start of flooding treatment and number of moles (μmol/g dry weight), respectively. (c) Log–log plot of experimental versus simulated data for 11 fitting-target metabolites. Black and blue circles show data for control and flooded models, respectively. Abbreviations used: 2OG, 2-oxoglutarate; Ala, alanine; Asp, aspartic acid; EP, enolpyruvate; GABA, γ-aminobutyric acid; GDP, guanosine 5′-diphosphate; Gln, glutamine; Glu, glutamate; GTP, guanosine 5′-triphosphate; Lac, lactate; LDHi, lactate dehydrogenase inhibitor; NAD, nicotinamide adenine dinucleotide; OAA, oxaloacetate; PEP, phosphoenol pyruvate; Pyr, pyruvate; SSA, succinic semialdehyde.

