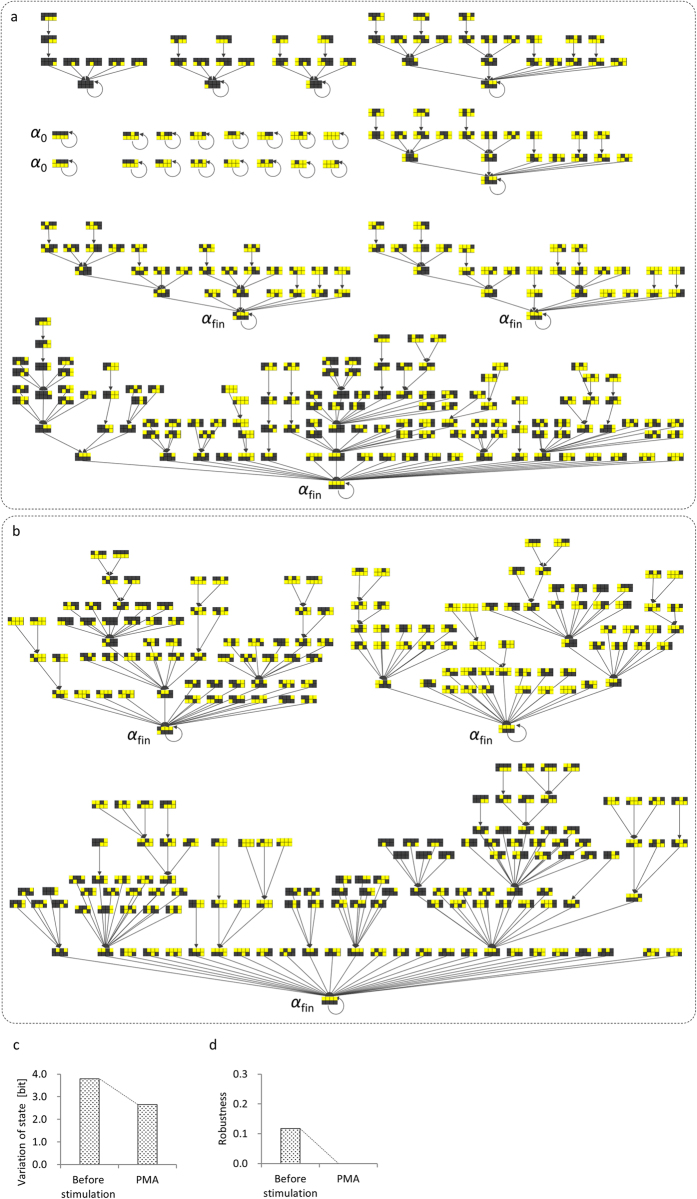
Figure 4. State representation of human myelomonocytic leukaemia cell transcriptional network under phorbol myristate acetate (PMA) stimulus.
(a,b) State trajectories before and after PMA stimulation15, respectively. Step functions (0 → 1 to module B1 and 1 → 0 to module B2) were supplied to mimic THP-1 cell differentiation under PMA stimulation. States of modular network structure are shown in checkerboards, where upper row, from left to right, indicates states of A1, B1, C1 and D1 modules, and lower row indicates states of A2, B2, C2 and D2 modules (see Fig. 3). Modules in checkerboards are coded as ‘active’ (yellow) or ‘inactive’ (black). αfin indicates states that mimic the final expression pattern as determined by qRT-PCR; α0 indicates states that mimic the initial expression pattern. (c) Variation of state measured by bit before and after PMA stimulation. Variation of state was calculated over eight units of time. (d) Robustness before and after PMA stimulation.

