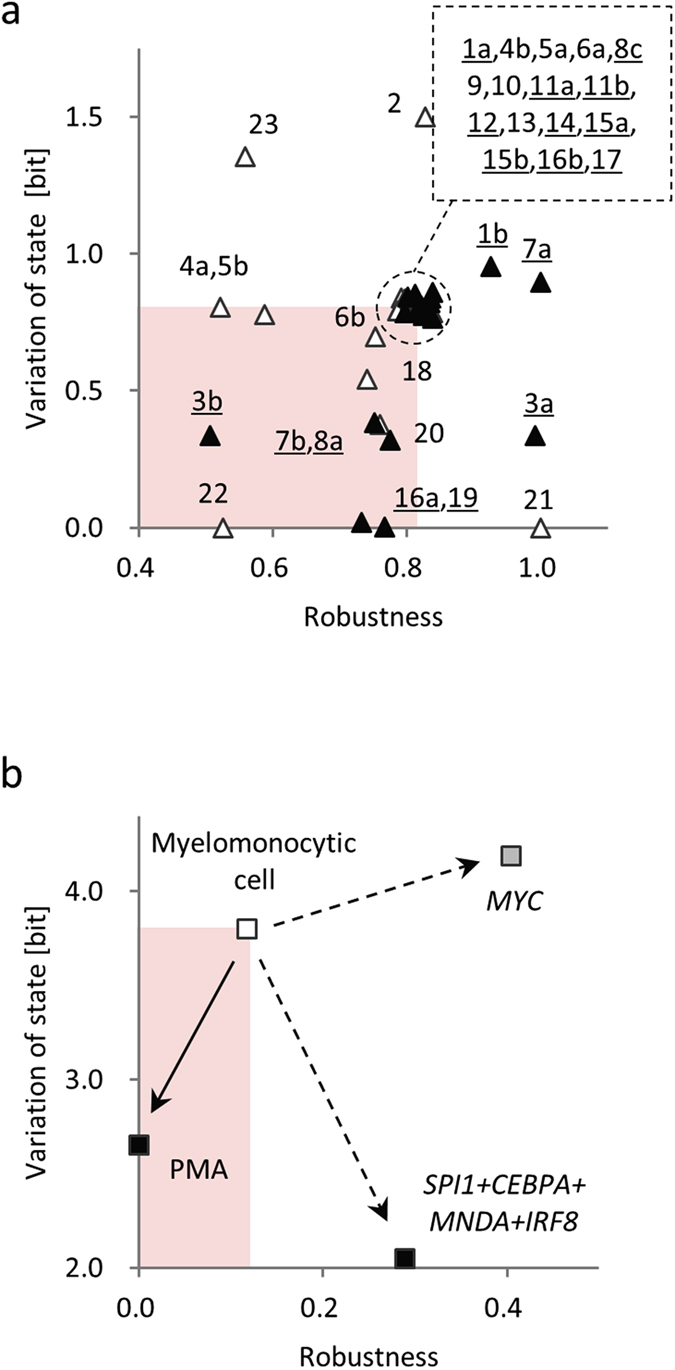
Figure 5. Application simulation experiments.

(a) Results of simulations for genetic modification. Vertical axis shows variation of state during 4-day simulation period. Alphanumeric symbols attached to triangle indicate reaction number in metabolic data (reaction details are documented in Supplementary Table S1). Filled and open triangles indicate that corresponding enzyme was ‘expressed’ or ‘not expressed’, respectively, in the proteome data33,34. Underlined alphanumeric symbols indicate that corresponding enzyme was ‘expressed’. A circle-by-dashed line indicates robustness–variation of state pairs that were the same as the value in the control model without over-expression of the enzymes. (b) Results of simulations for degree of dedifferentiation. Vertical axis shows variation of state calculated over eight units of time. Open rectangle indicates robustness–variation of state pairs before treatment. Black or grey rectangles indicate robustness–variation of state pairs after treatment that induced THP-1 cell differentiation or dedifferentiation, respectively. Solid arrow indicates robustness–variation of state pair transition by the simulation mimicking extracellular phorbol myristate acetate (PMA) treatment. Dashed arrow indicates robustness–variation of state pair transition by simulation mimicking intracellular enforced expression of key transcription factors. Red shading in both panels indicates where both robustness and variation of state decreased after treatment.
