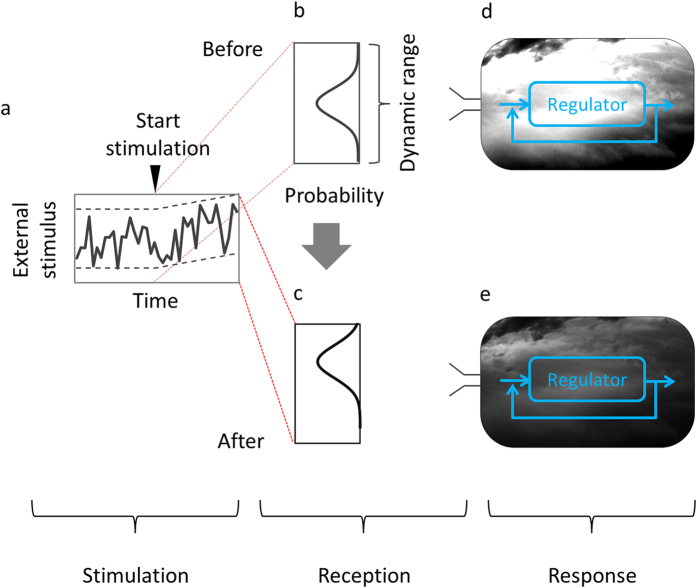
Figure 6. Hypothetical “external stimulus-induced information loss” model of biological systems.
(a) Temporal profile of external stimulus. (b,c) Distribution curves of external stimulus. Distribution curve shifts against the dynamic range before (b) and after (c) external stimulation. (d,e) Biological system before (d) and after (e) external stimulation. Biological system has physiological regulation systems. Change in highly varied (d) to low-varied (e) density in the cloud images represents decrease in the amount of biological system information caused by the external stimulation. Before external stimulation, biological system was filled with rich information (d), which was lost after external stimulation (e). These cloud images represent the amount of decrease in variation in the state trajectories in the soybean metabolic network under a flooding stimulus, or in the human myelomonocytic leukaemia cell transcriptional network under a phorbol myristate acetate (PMA) stimulus. Number of types of final states that existed before external stimulation (Figs 2a and 4a) decreased in state patterns after external stimulation (Figs 2e and 4b).

