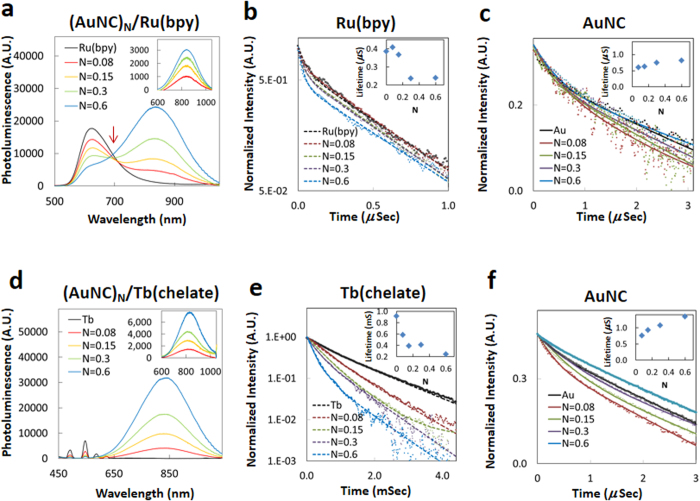
Figure 4. Steady state and time-resolved data from conjugating Ru(bpy) and Tb(chelate) donor to AuNC acceptors.
PL changes from donors titrated with a mixture of “N” equivalents of AuNCs. (a,d) PL changes of (AuNC)N/Ru(bpy) system and (AuNC)N/Tb(chelate), respectively, excited at 470 nm. Inset is the net PL spectral changes from AuNCs representing the sensitized acceptor intensity component. (b,e) Excited state lifetime measurements of Ru(bpy) and Tb(chelate) in (AuNC)N/donor systems, respectively. Inset plots the conjugation ratio (N) dependence of the donor’s averaged lifetimes. In e, the apparent rise-time differences are attributed to the slow CS-124 to Tb to AuNC transfer processes and are not considered for excited state lifetime calculation. (c,f) Excited state lifetime measurements of AuNC in (AuNC)N/donor systems. Inset shows the conjugation ratio (N) dependence of the AuNC averaged lifetimes.

