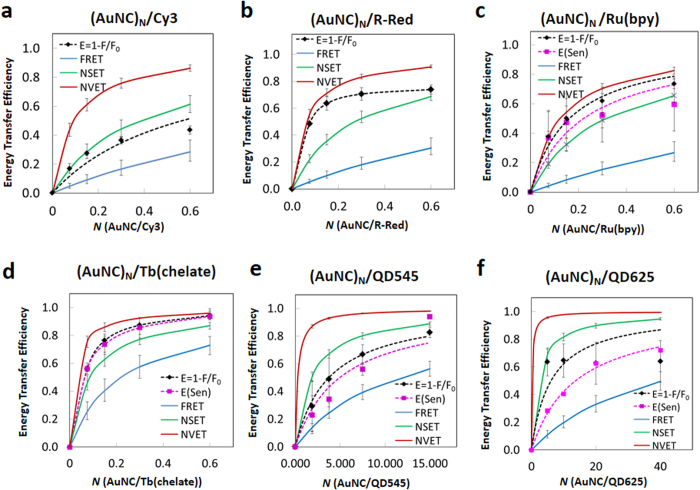
Figure 6. Comparison of ET efficiencies predicted by theoretical models with experimental results.
FRET (blue solid line), NSET (green solid line), NVET (red solid line), ET efficiency from donor PL loss (black diamond, fitting based on kET in Table 3) and AuNC sensitization (magenta square, line of best fit). (a) (AuNC)N/Cy3, (b) (AuNC)N/R-Red, (c) (AuNC)N/Ru(bpy), (d) (AuNC)N/Tb(chelate), (e) (AuNC)N/QD545, and (f) (AuNC)N/QD625, respectively. Error bars represent the standard deviation of the experimental data, while the error bars on the model predictions represent the extrapolated minima and maxima from the estimated range of donor-acceptor separation distances.

