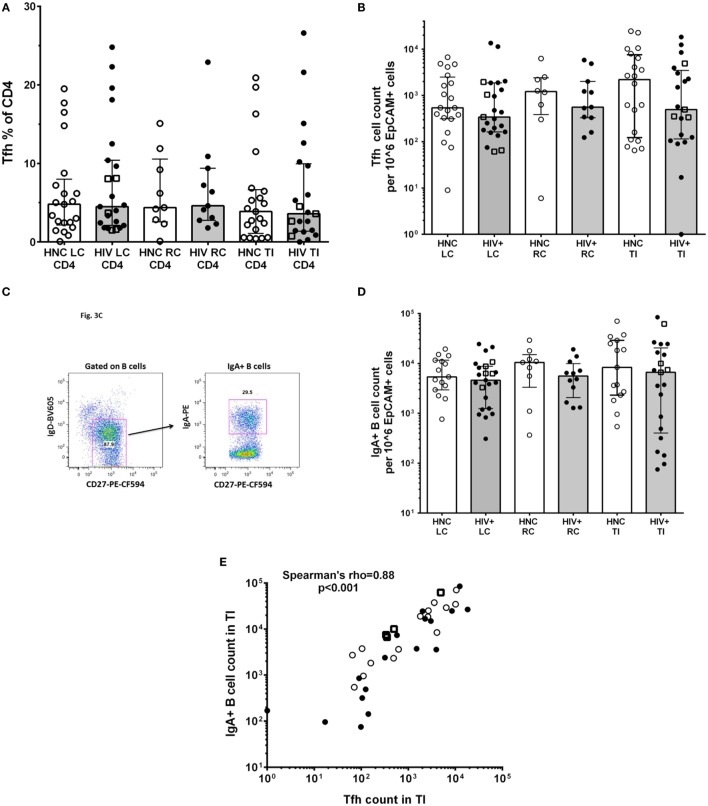
Figure 3.
(A) PD-1highCXCR5+ Tfh cells % of CD4+ in gut biopsies from HIV-negative controls (HNC) compared with HIV+ subjects on ART, respectively, for left colon (LC), right colon (RC), and terminal ileum (TI). (B) Tfh cell counts in gut biopsies from HIV-negative controls (HNC) compared with HIV+ subjects on ART, respectively, for left colon (LC), right colon (RC), and terminal ileum (TI). Open square symbols indicate HIV+ subjects who commenced ART during primary HIV-1 infection. (C) Representative flow plots showing gating for IgA+CD27+ B cells in gut biopsies. (D) IgA+CD27+ B cell counts in gut biopsies from HIV-negative controls (HNC) compared with HIV+ subjects on ART, respectively, for left colon (LC), right colon (RC), and terminal ileum (TI). Open square symbols indicate HIV+ subjects who commenced ART during primary HIV-1 infection. (E) Correlation between IgA+ B cell counts in terminal ileum (TI) and Tfh cell counts in terminal ileum (TI), for each individual subject. Open square symbols indicate HIV+ subjects who commenced ART during primary HIV-1 infection.

