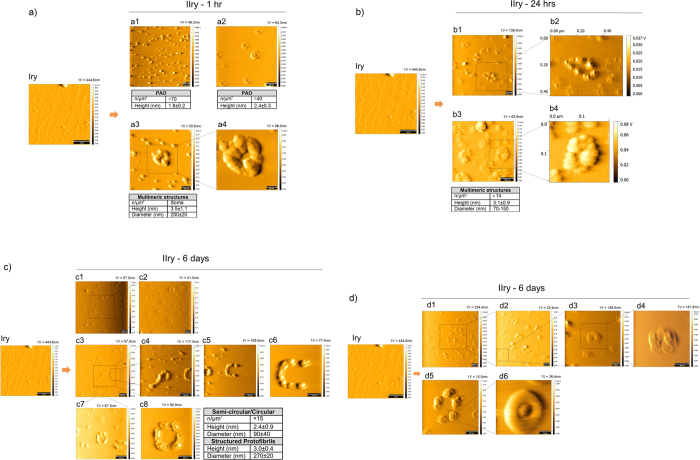
Figure 5. PAO budding and migration.
Fibrils were adsorbed on primary (Iry) mica surface (scale bar 1 μm). An empty secondary (IIry) mica was placed in contact with the primary mica and followed up to 6 days. Contact solution: 10 mM PBS at pH 7.4, T = 25 °C. A TM representative topography image of a pristine primary coated with fibrils is shown as primary (Iry). (a) Numerous PAO are adsorbed on the secondary mica after 1 hr of contact (scale bars: 50 nm (a2,a4) and 100 nm (a1,a3). At this time transitional structures (a2) and scarce annular protofibrils (a3–a4) are adsorbed on the IIry. (b) More complex multimeric structures (MS) appear after 24 hrs (scale bars: 100 nm). The inserts b2 and b4 were magnified with the software therefore do not have the scale bar within the figure. (c,d) semi circular, circular (c1–c8) and more structured protofibrils (c4) and transitional structures (d5,d6), appear after 6 days (scale bars: 10 nm (d6), 50 nm (c6,c8,d3–d5), 100 nm (c2,c4,c5,c7,d2), and 200 nm (c1,c3,d1)). The number and size of the structures are indicated in the table under each experimental time point. The amplitude scale is in Volt; we indicated the height (nm) corresponding to 1 Volt.

