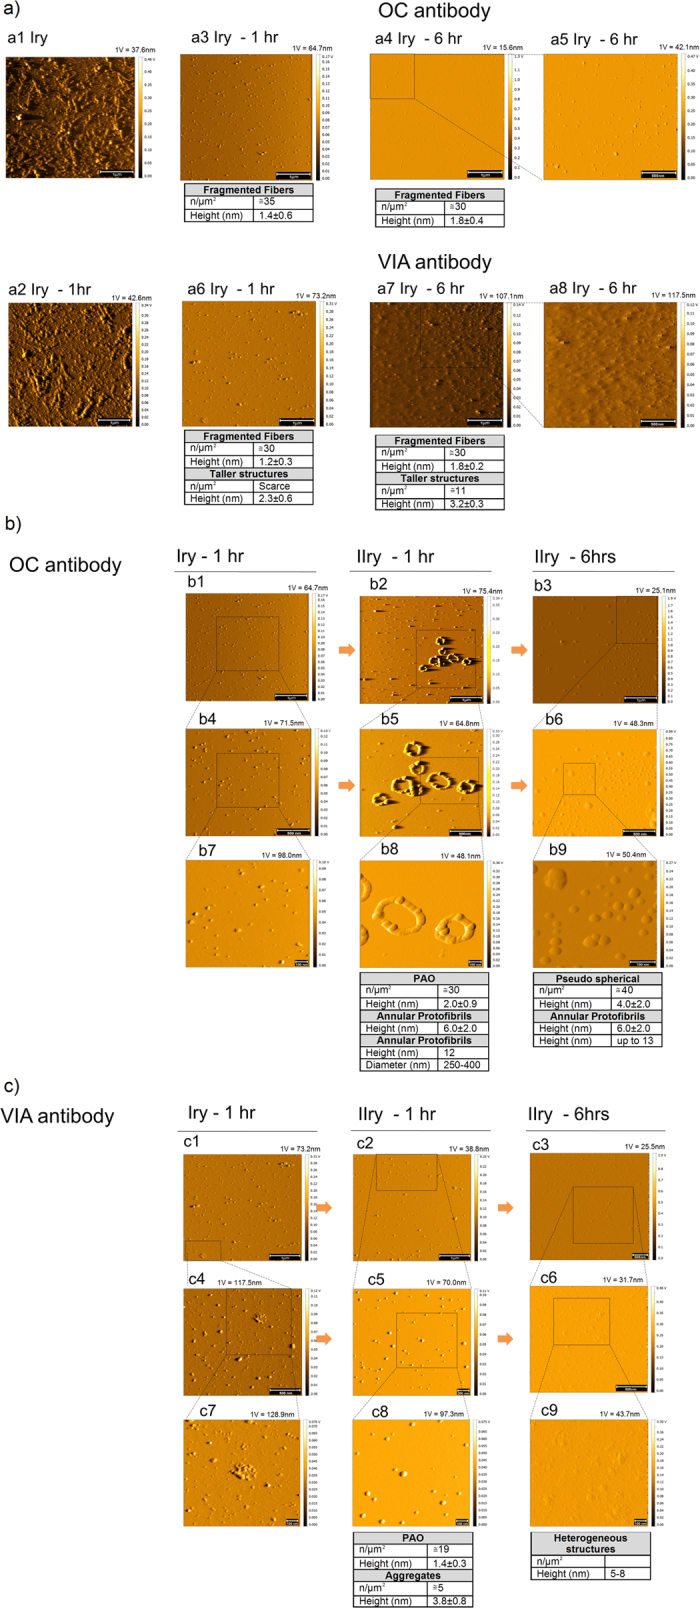
Figure 7. Fiber and PAO response to structural antibodies.

Treatment with antibodies against amyloid fibers (OC) and Aβ42-PAO (VIA) results in fragmentation of the fibers on the primary surface (a) while PAO and circular protofibrils grow on the secondary surface with the anti-fiber antibodies (OC) (b). Treatment with antibodies against Aβ42 PAO (VIA) also led to fibers fragmentation both on primary and secondary surfaces (c). (Scale bars: 100 nm (b7–b9,c7–c9), 200 nm (c5), 500 nm (a5,a8,b4–b6,c3,c4,c6), and 1 μm (a1–a4,a6,a7,b1–b3,c1,c2)). (a) TM topography images of fibrils adsorbed on a primary and placed in semi-contact for 0, 1 and 6 hrs with a secondary using solutions containing structural ≅5 μM OC or VIA antibodies. The image of a pristine primary coated with fibrils is shown in a1. For comparison, a2 shows the same surface after 1 hr of semi-contact in 10 mM PBS alone. (b,c) TM topography images of a primary after 1 hr and the corresponding secondary after 1 hr and 6 hrs using solutions containing OC (b) and VIA (c). For both antibodies, pseudo-spherical fibril fragments are observed on the primary (a3–a8). After 1 hr of semi-contact with OC antibodies (b2,b5,b8), PAO and annular protofibrils grow on the secondary; later (6 hrs, b3,b6,b9) non homogenously dispersed pseudo-spherical PAO and aggregates of large dimensions are observed. After 1 hr of semi-contact with VIA antibodies (c2,c5,c8) spherical PAO and aggregates form on the secondary, later (6 hrs, c3,c6,c9) a deposition of heterogeneous structures arises, some of which reaching the height of 5–8 nm. The number and size of the structures are indicated in the table under each experimental time point. The amplitude scale is in Volt; we indicated the height (nm) corresponding to 1 Volt.
