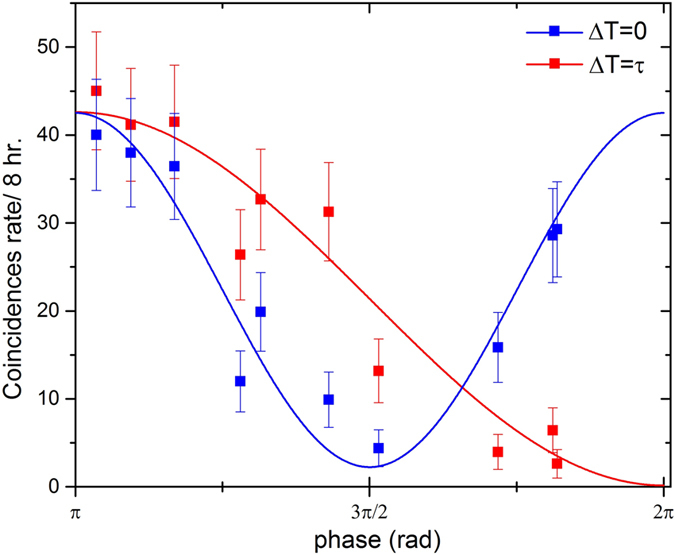
Figure 3. Experimental results.

Interference patterns recorded at the output of the device as a function of the phase setting in the MZI. Here blue and red data are given for two-photon and single photon interference, respectively. The uncertainty associated with each point has been calculated using standard squared root deviation associated with the Poissonian distribution of the photocounts. The curves are fits of Eqs 5 and 6 to the experimental data where the only free parameters are the visibility and the amplitude.
