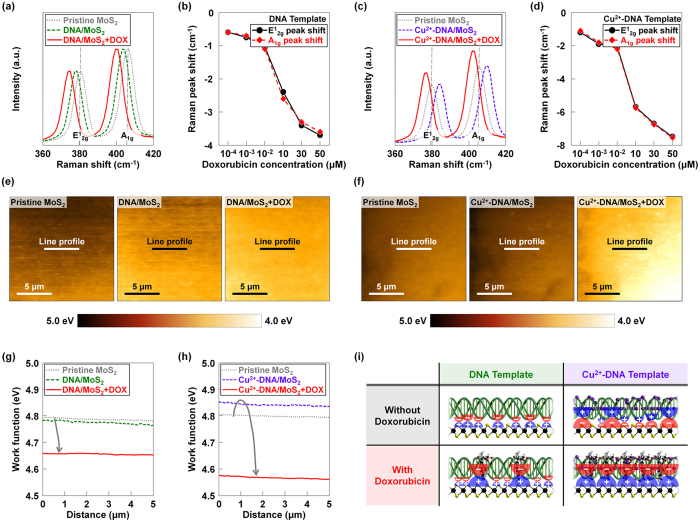
Figure 2. The influence of receptor (DNA and Cu2+-DNA) and target (doxorubicin) molecules on MoS2.
Raman spectra taken on (a) pristine MoS2, DNA/MoS2 and (c) pristine MoS2, Cu2+-DNA/MoS2 before and after being exposed to 50 μM doxorubicin molecules. Extracted E12g and A1g peaks of the MoS2 flakes coated by (b) DNA and (d) Cu2+-DNA nanostructures after being exposed to doxorubicin molecules with various concentrations (10−4 μM, 10−3 μM, 10−2 μM, 10 μM, 30 μM, and 50 μM). KPFM mapping images and work function values were respectively obtained on the (e) pristine MoS2 surface, DNA/MoS2 surface before and after being exposed to 50 μM doxorubicin molecules, and (f) pristine MoS2 surface, Cu2+-DNA/MoS2 surface before and after being exposed to 50 μM doxorubicin molecules. The work function values on the (g) pristine MoS2, DNA/MoS2 surface and (h) pristine MoS2, Cu2+-DNA/MoS2 before and after being exposed to 50 μM doxorubicin molecules. (i) The schematic diagrams presenting the predicted dipoles on DNA/MoS2 and Cu2+-DNA/MoS2 hybrid structures before and after doxorubicin molecules are detected.

