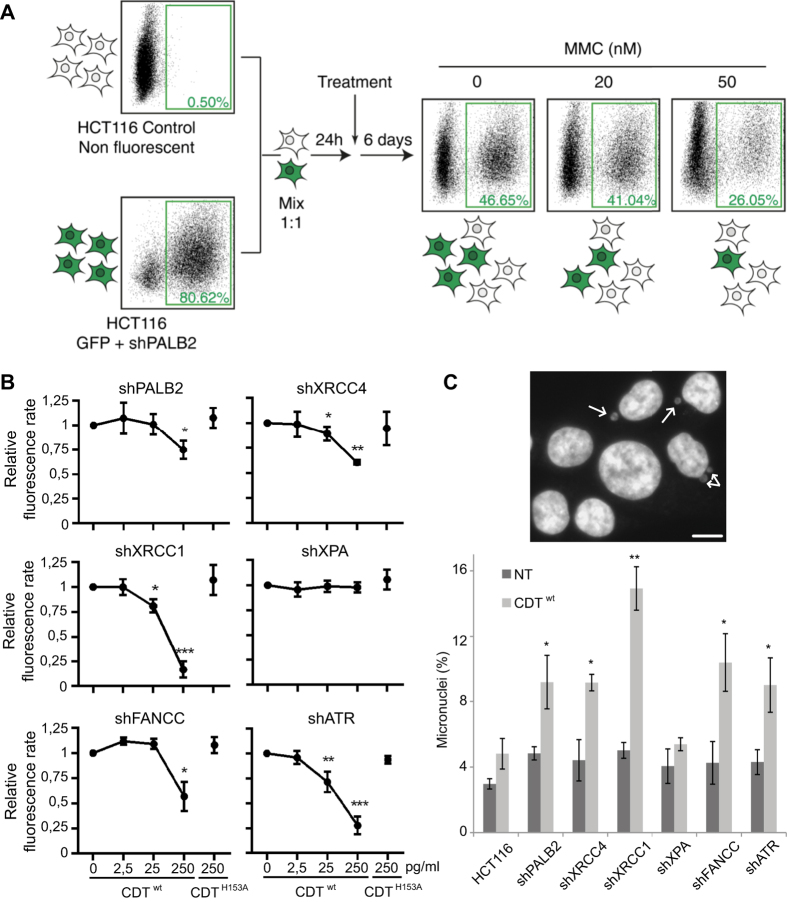
Figure 1. Principle and results of the MCA assay after CDT exposure.
(A) Schematic representation of the Multicolor Competition Assay (MCA) exemplified by the validation of the shPALB2 cell line. The shRNA-mediated down-regulation of PALB2 is coupled to the green fluorescent protein (GFP) expression. Cells were co-cultured with non-fluorescent control cells with a ratio 1:1 and, after 1 day, treated with 0, 20 or 50 nM of Mitomycin C (MMC) for 6 days. MMC induces a dose-dependent decrease of the fluorescence rate, indicating a sensitization of the shPALB2 cell line. (B) MCA analysis in HCT116 cells expressing a shRNA directed against PALB2, XRCC4, XRCC1, XPA, FANCC or ATR. Cells were treated for 6 days with increasing doses of CDTwt or with 250 pg/ml of CDTH153A. Data are expressed as the mean ± SD of at least 3 independent experiments. Statistics were calculated by paired Student’s t-test (*P < 0.05; **P < 0.01; ***P < 0.001). (C) Micronucleus frequency in HCT116 cells presented in (B) after chronic exposure to CDTwt. Upper panel shows a representative image of HCT116 cells chronically exposed to 25 pg/ml of CDTwt for 2 to 3 weeks. Scale bar = 20 μm. The frequency of cells with micronuclei (white arrows) was quantified by fluorescence visualization after DAPI staining (lower panel). Data are expressed as the mean ± SD of 3 experiments. Statistics were calculated by paired Student’s t-test (*P < 0.05; **P < 0.01).

