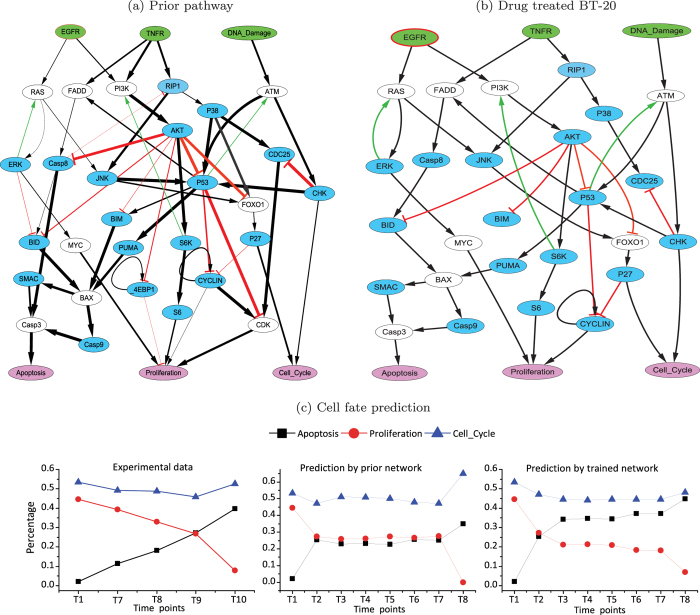
Figure 5. Predictions of cell fates by prior and learned networks.
(a) Prior signaling network derived from two manually curated signaling pathways proposed in our previous studies36,37. The black and red edges represent interactions of types activation and inhibition, and green edges represent feedback interactions. (b) Network inferred by using the phosphoproteomic time-series data of the E → D treated BT-20 cell line. (c) Dynamic curves of three cell fates, i.e. apoptosis, proliferation and cell cycle arrest, corresponding to experimental observations, the predictions by the prior network and trained network, respectively.

