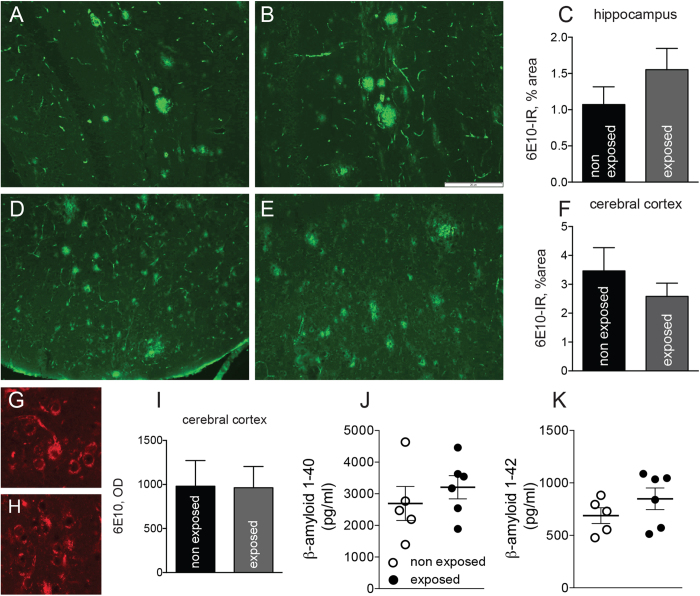
Figure 3. Effect of REAC exposure on brain amyloid pathology.
(A,B) representative micrographs (A,B) and quantification (C) of amyloid plaque burden in the hippocampus of non exposed (A) and REAC-exposed (B) Tg2576 mice; (D,E) representative micrographs (D,E) and quantification (F) of amyloid plaque burden in the cerebral cortex of non exposed (D) and REAC-exposed (E) Tg2576 mice; (G,H) representative micrographs and quantification (I) of intraneuronal 6E10-IR amyloid in the cerebral cortex of non exposed (G) and REAC-exposed (H) Tg2576 mice. Bar: 20 μm. (J,K) Amyloid 40 (J) and 42 peptide (K) in the plasma of non exposed (white dot) and REAC-exposed (black dot) Tg2576 mice. Six animals in the “exposed” and five animals in the “non exposed” groups were included (see methods for details). Data are expressed as mean + SEM. Statistical analysis was performed by Student’s t test.

