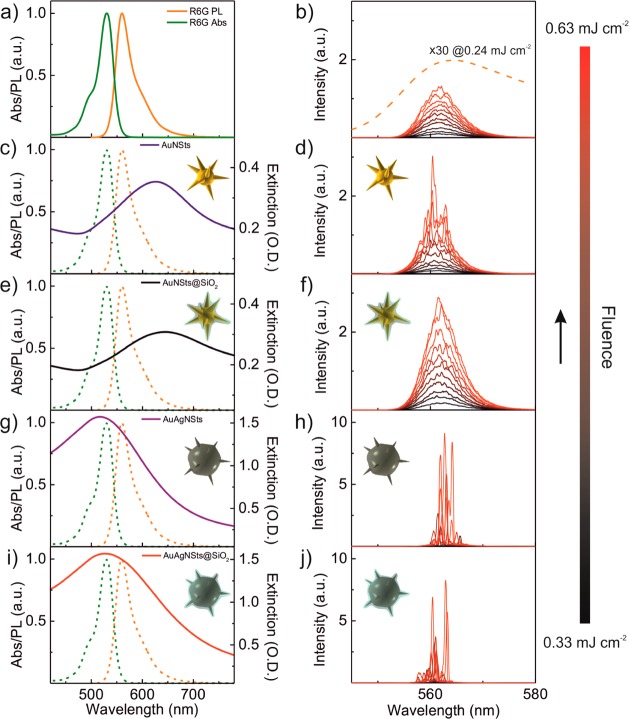
Figure 3.
(a) Normalized absorption (green) and photoluminescence (PL) (orange) spectra of R6G; (b) ASE spectra of the reference R6G solution without nanostars, excited by single pulses at different excitation fluences from 0.33 to 0.66 mJ cm–2 in steps of 0.03 mJ cm–2. The intensity of the PL spectra of R6G at a pumping fluence of 0.24 mJ cm–2 (dashed orange curve) was magnified 30 times for comparison. (c,e,g,i) Spectral overlap of the R6G absorption and emission spectra (dotted curves) with the extinction spectra of respective nanostars in ethanol (solid lines) and (d,f,h,j) the emission (random lasing or ASE) spectra at different excitations fluences for nanostars/R6G mixtures. (c,d) AuNSts, (e,f) AuNSts@SiO2, (g,h) AuAgNSts, and (i,j) AuAgNSts@SiO2, respectively.

