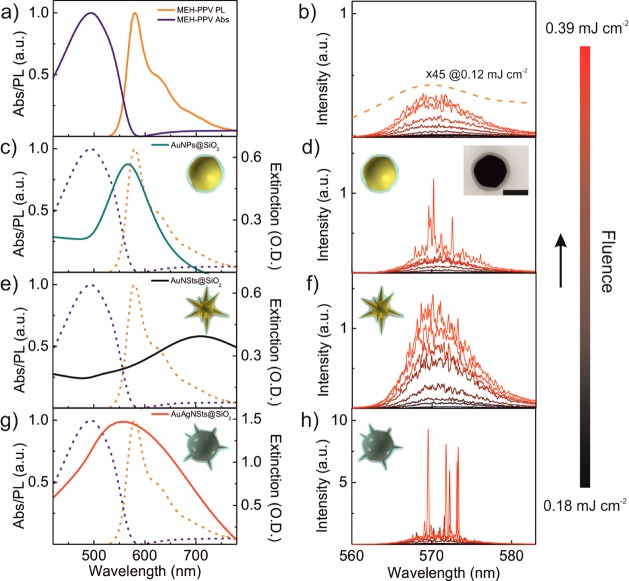
Figure 5.
(a) Normalized absorption (blue) and photoluminescence (PL) (orange) spectra of the MEH-PPV in chlorobenzene solution; (b) ASE spectra of the reference MEH-PPV solution without nanostars, excited by single pulses at different excitation fluences. The intensity of the PL spectra of MEH-PPV at a pumping fluence of 0.12 mJ cm–2 (dashed orange curve) was magnified 45 times for comparison. (c–h) Spectral overlap of the MEH-PPV absorption and emission spectra (dotted curves) with the extinction spectra of respective silica-coated nanoparticles in chlorobenzene (solid lines) and the emission (ASE or random lasing) spectra at different excitations fluences for nanoparticles/MEH-PPV mixtures: (c,d) AuNPs@SiO2, (e,f) AuNSts@SiO2, (g,h) AuAgNSts@SiO2, respectively. The inset in (d) shows the TEM image of a representative AuNP@SiO2 nanoparticle. The scale bar is 100 nm.

