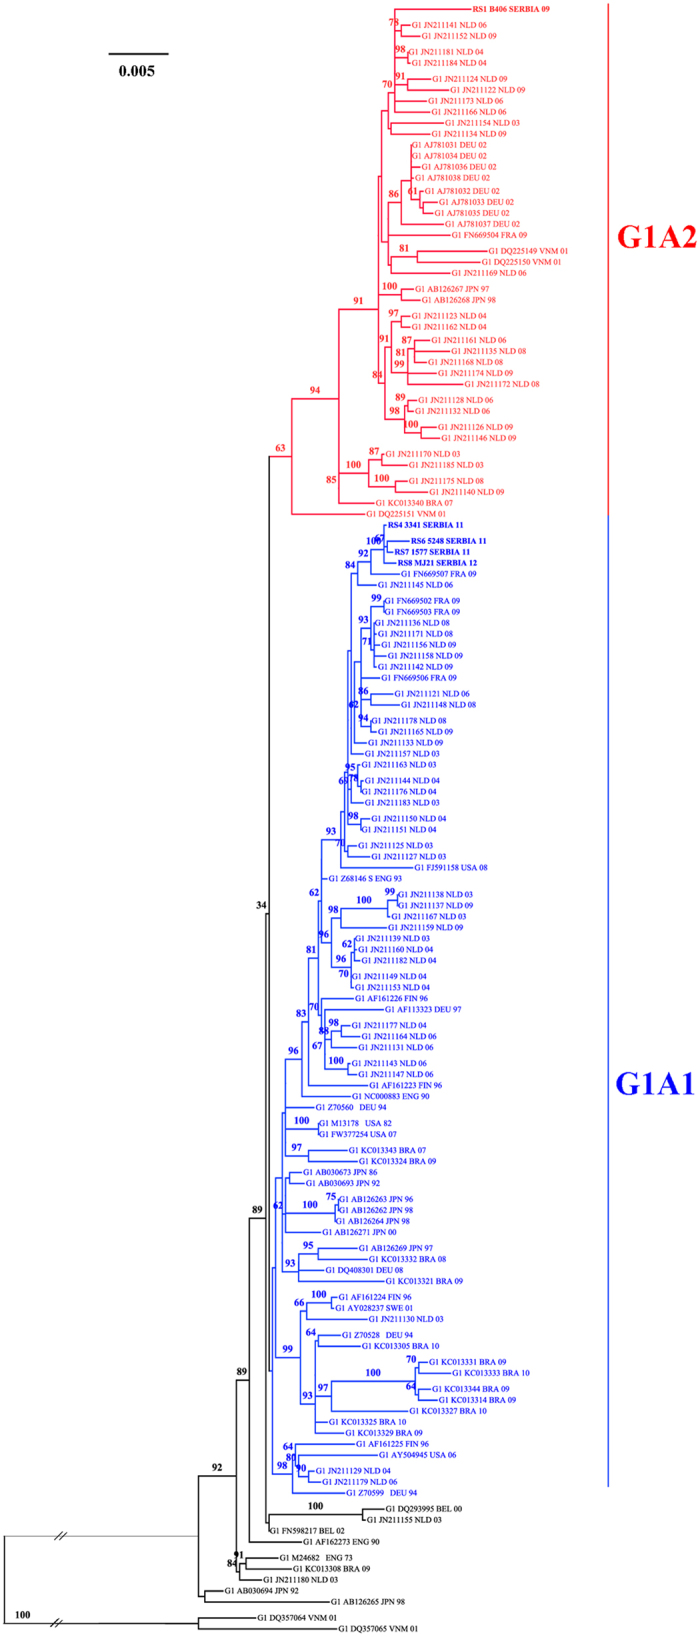
Figure 1. Phylogeny of B19 genotype 1 complete coding region.

Legend for Fig. 1: 133 studied isolates are presented with GenBank accession number, three letters ISO country code and year of isolation. The ML tree was constructed using PAUP, under the best-fit substitution model as determined by jModeltest, TIM3 G + I (CI 95%). Bootstrap values with 1000 replicates were obtained using IQTREE online software.
