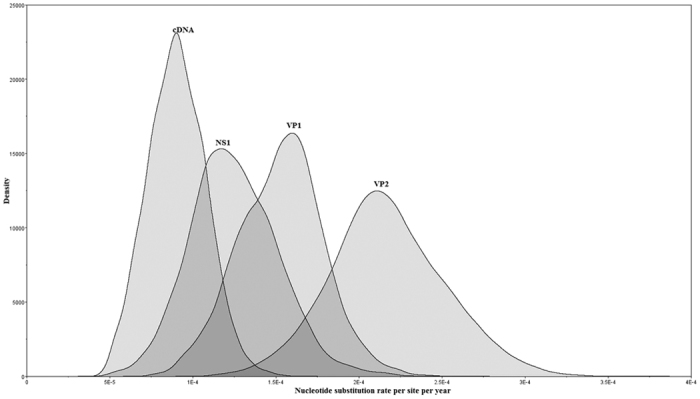
Figure 3. Evolutionary rates for B19 cDNA and genome partitions.

Legend for Fig. 3: Marginal distributions of the rates from the different genome partitions; analysis was performed using BEAST under strict clock model.

Legend for Fig. 3: Marginal distributions of the rates from the different genome partitions; analysis was performed using BEAST under strict clock model.